Data and source code at https://framagit.org/saji_nh/jp_pcr
The source code, data, and images may be freely used
without permission. However, the original data for PCR tests
and related statistics were
compiled by Toyo Keizai, and their efforts should be
acknowledged by citing their data repository
https://github.com/kaz-ogiwara/covid19.
Questions and comments may be addressed to
Saji N. Hameed by email (saji'at-mark'u-aizu.ac.jp)
PCR positives without Testing
PCR positives reported without tests
Data source
The data analyzed here is the PCR data reported for each of the 47 Japanese prefecture, and is taken from https://github.com/kaz-ogiwara/covid19/blob/master/README.md
What is reported here?
The data contains some data points where the number of positive PCR counts equal or exceeds the number of PCR tests. Since positive PCR results are always reported along with a test, this disparity needs to be documented and investigated.
-
In the table below, a summary is provided where the percentage of times this happens is the last column.
-
The prefectures where this anomaly happens most can be found towards the top of the table.
-
The total number of positives and tests in such suspicious data points is also provided.
-
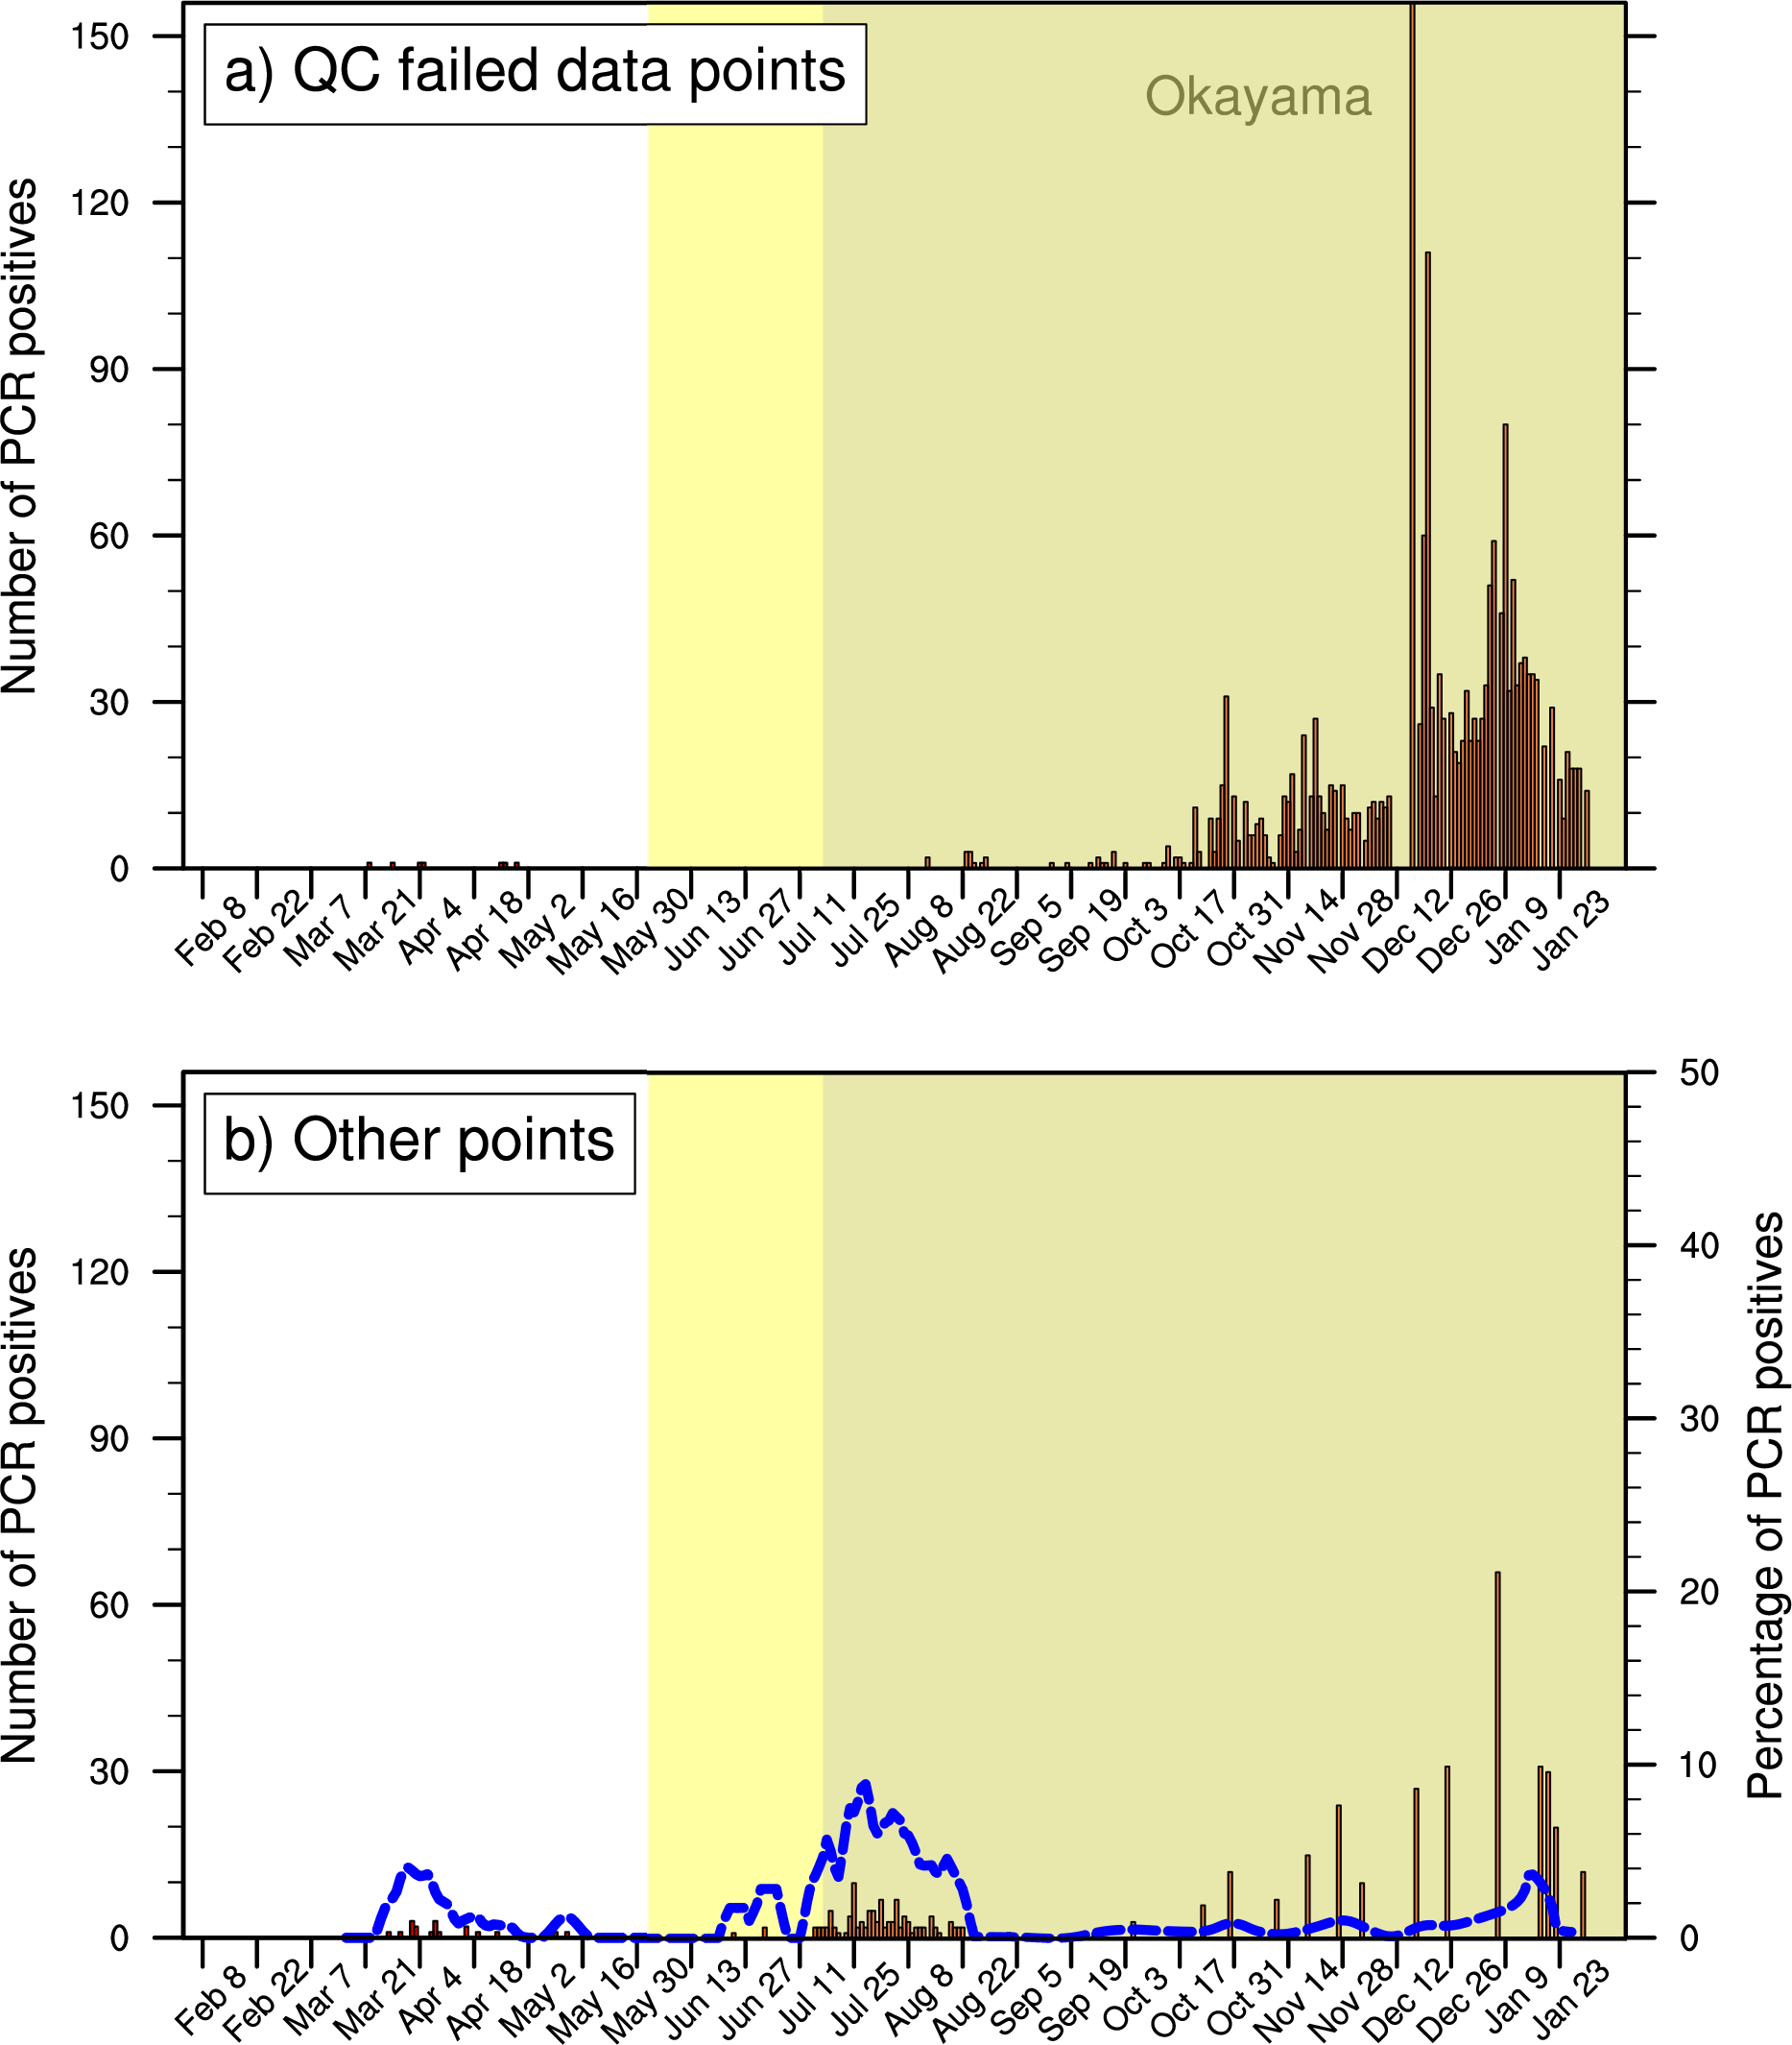
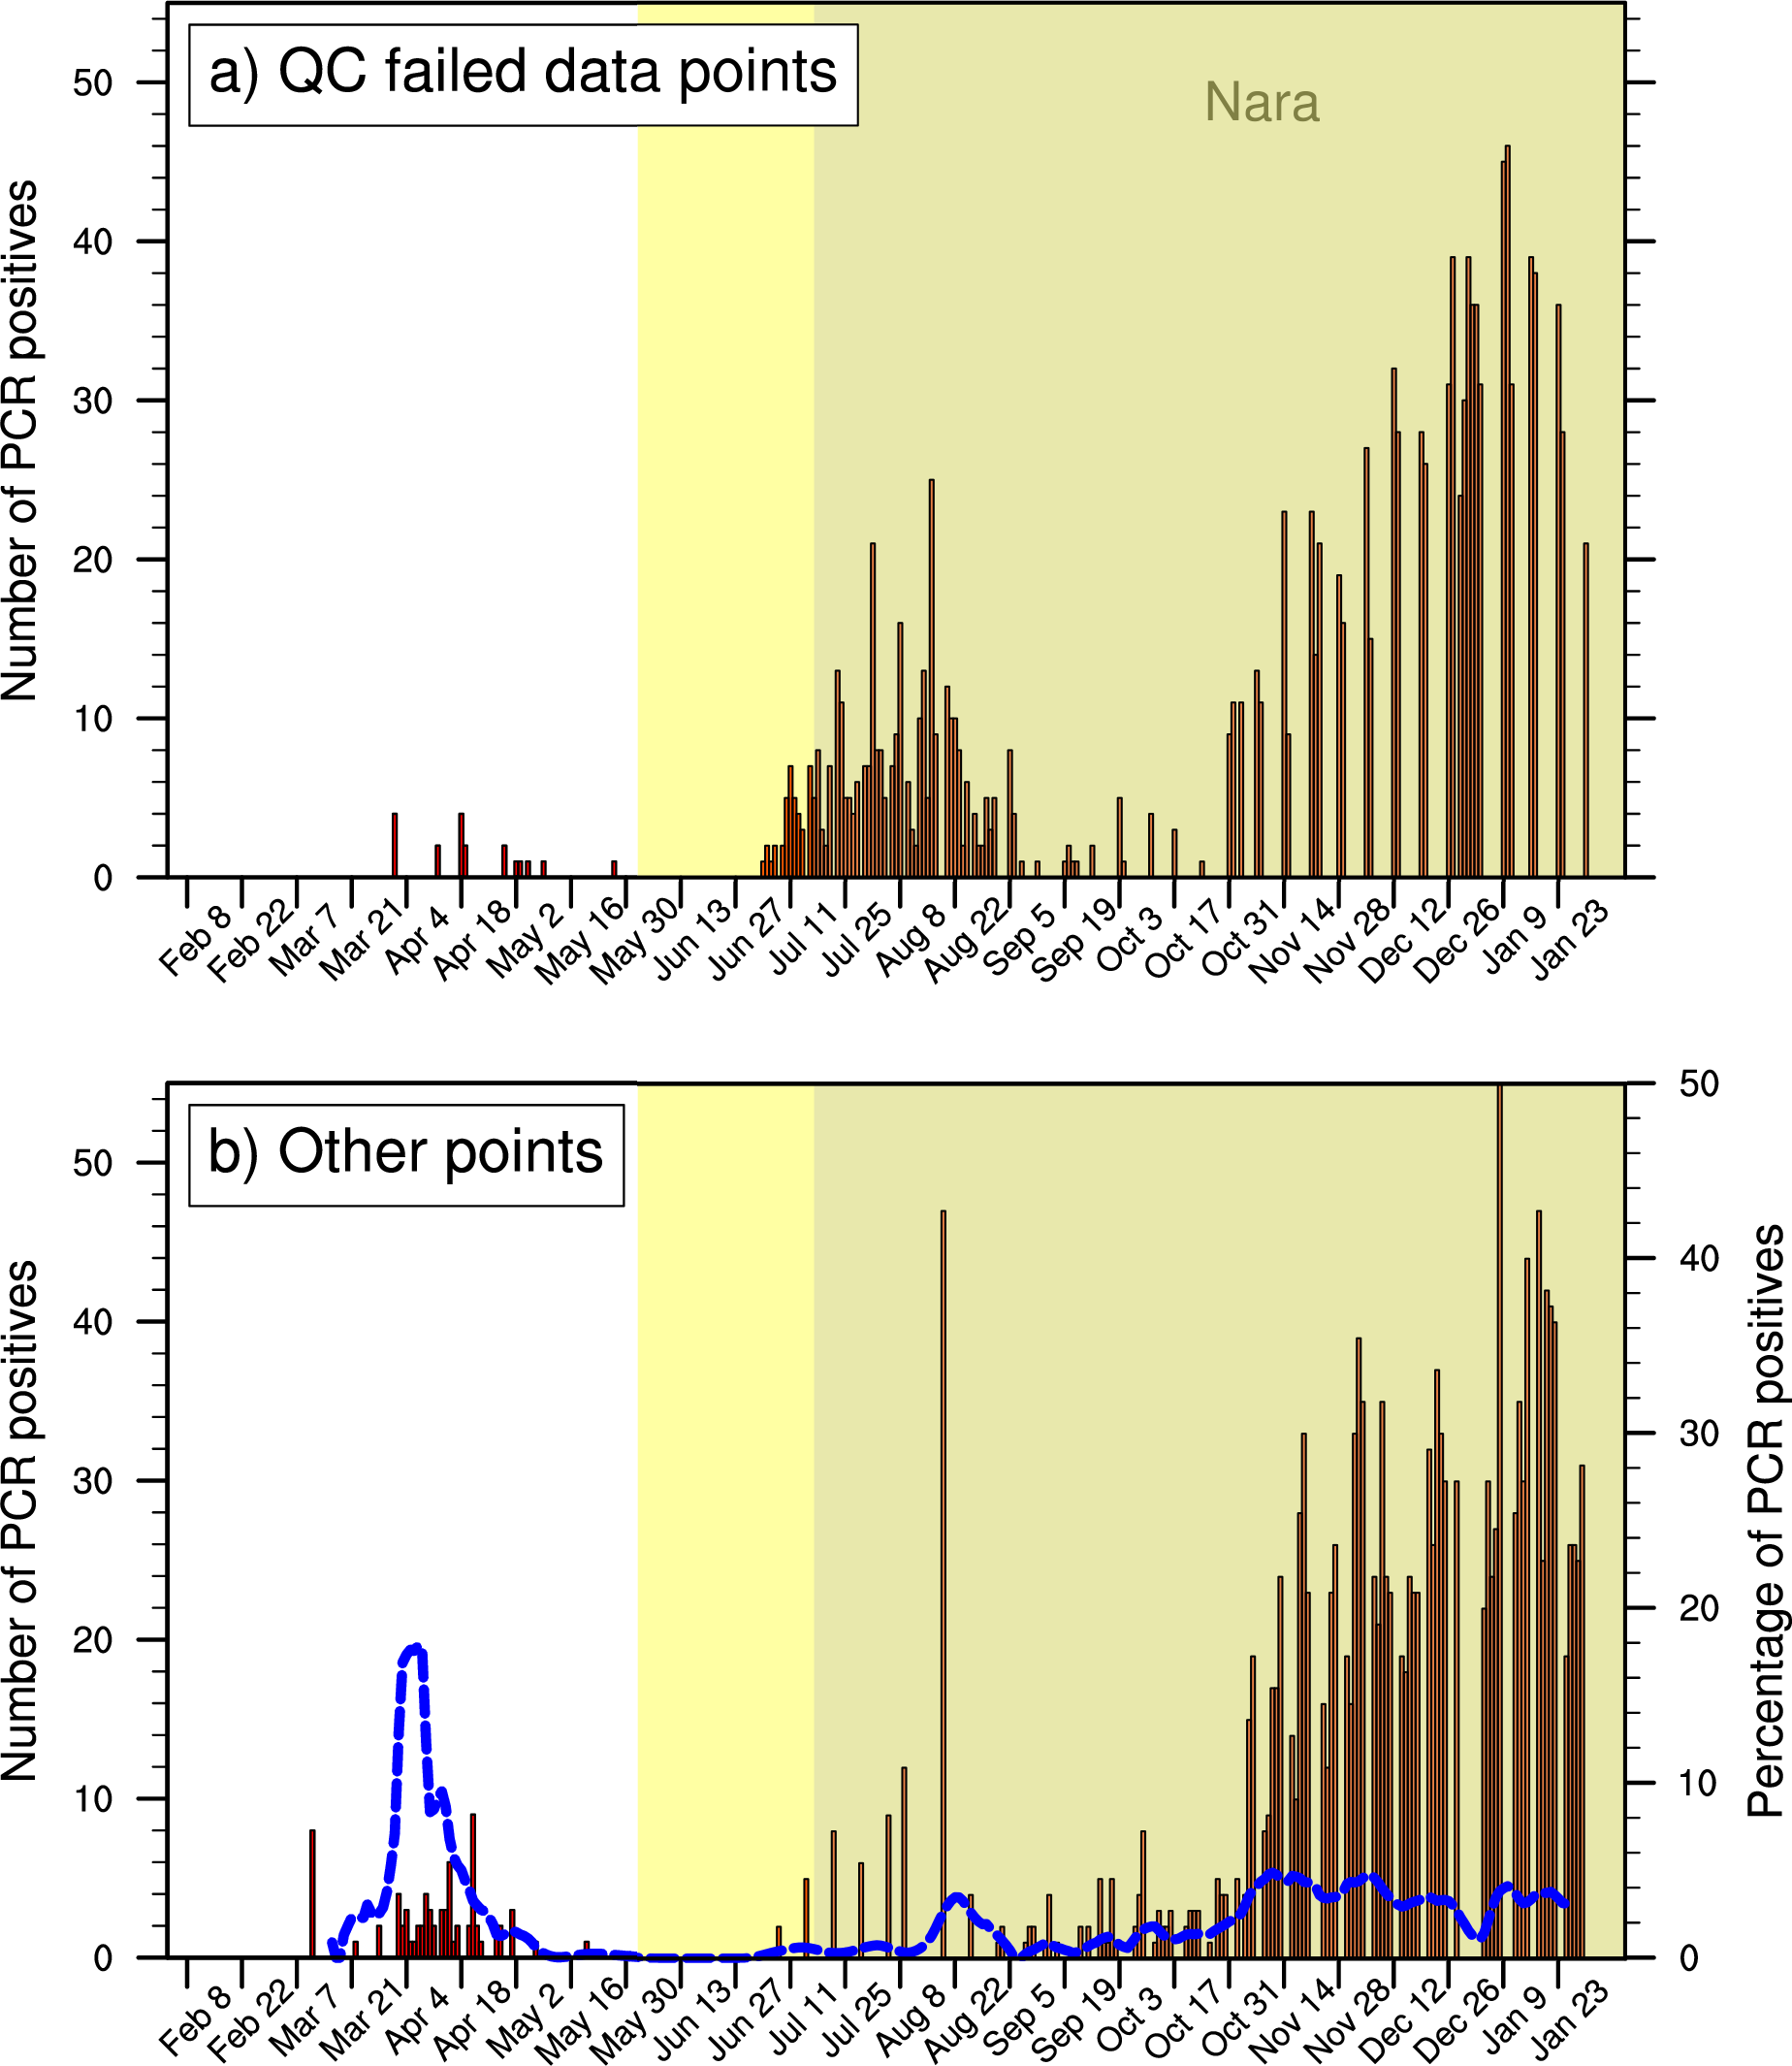
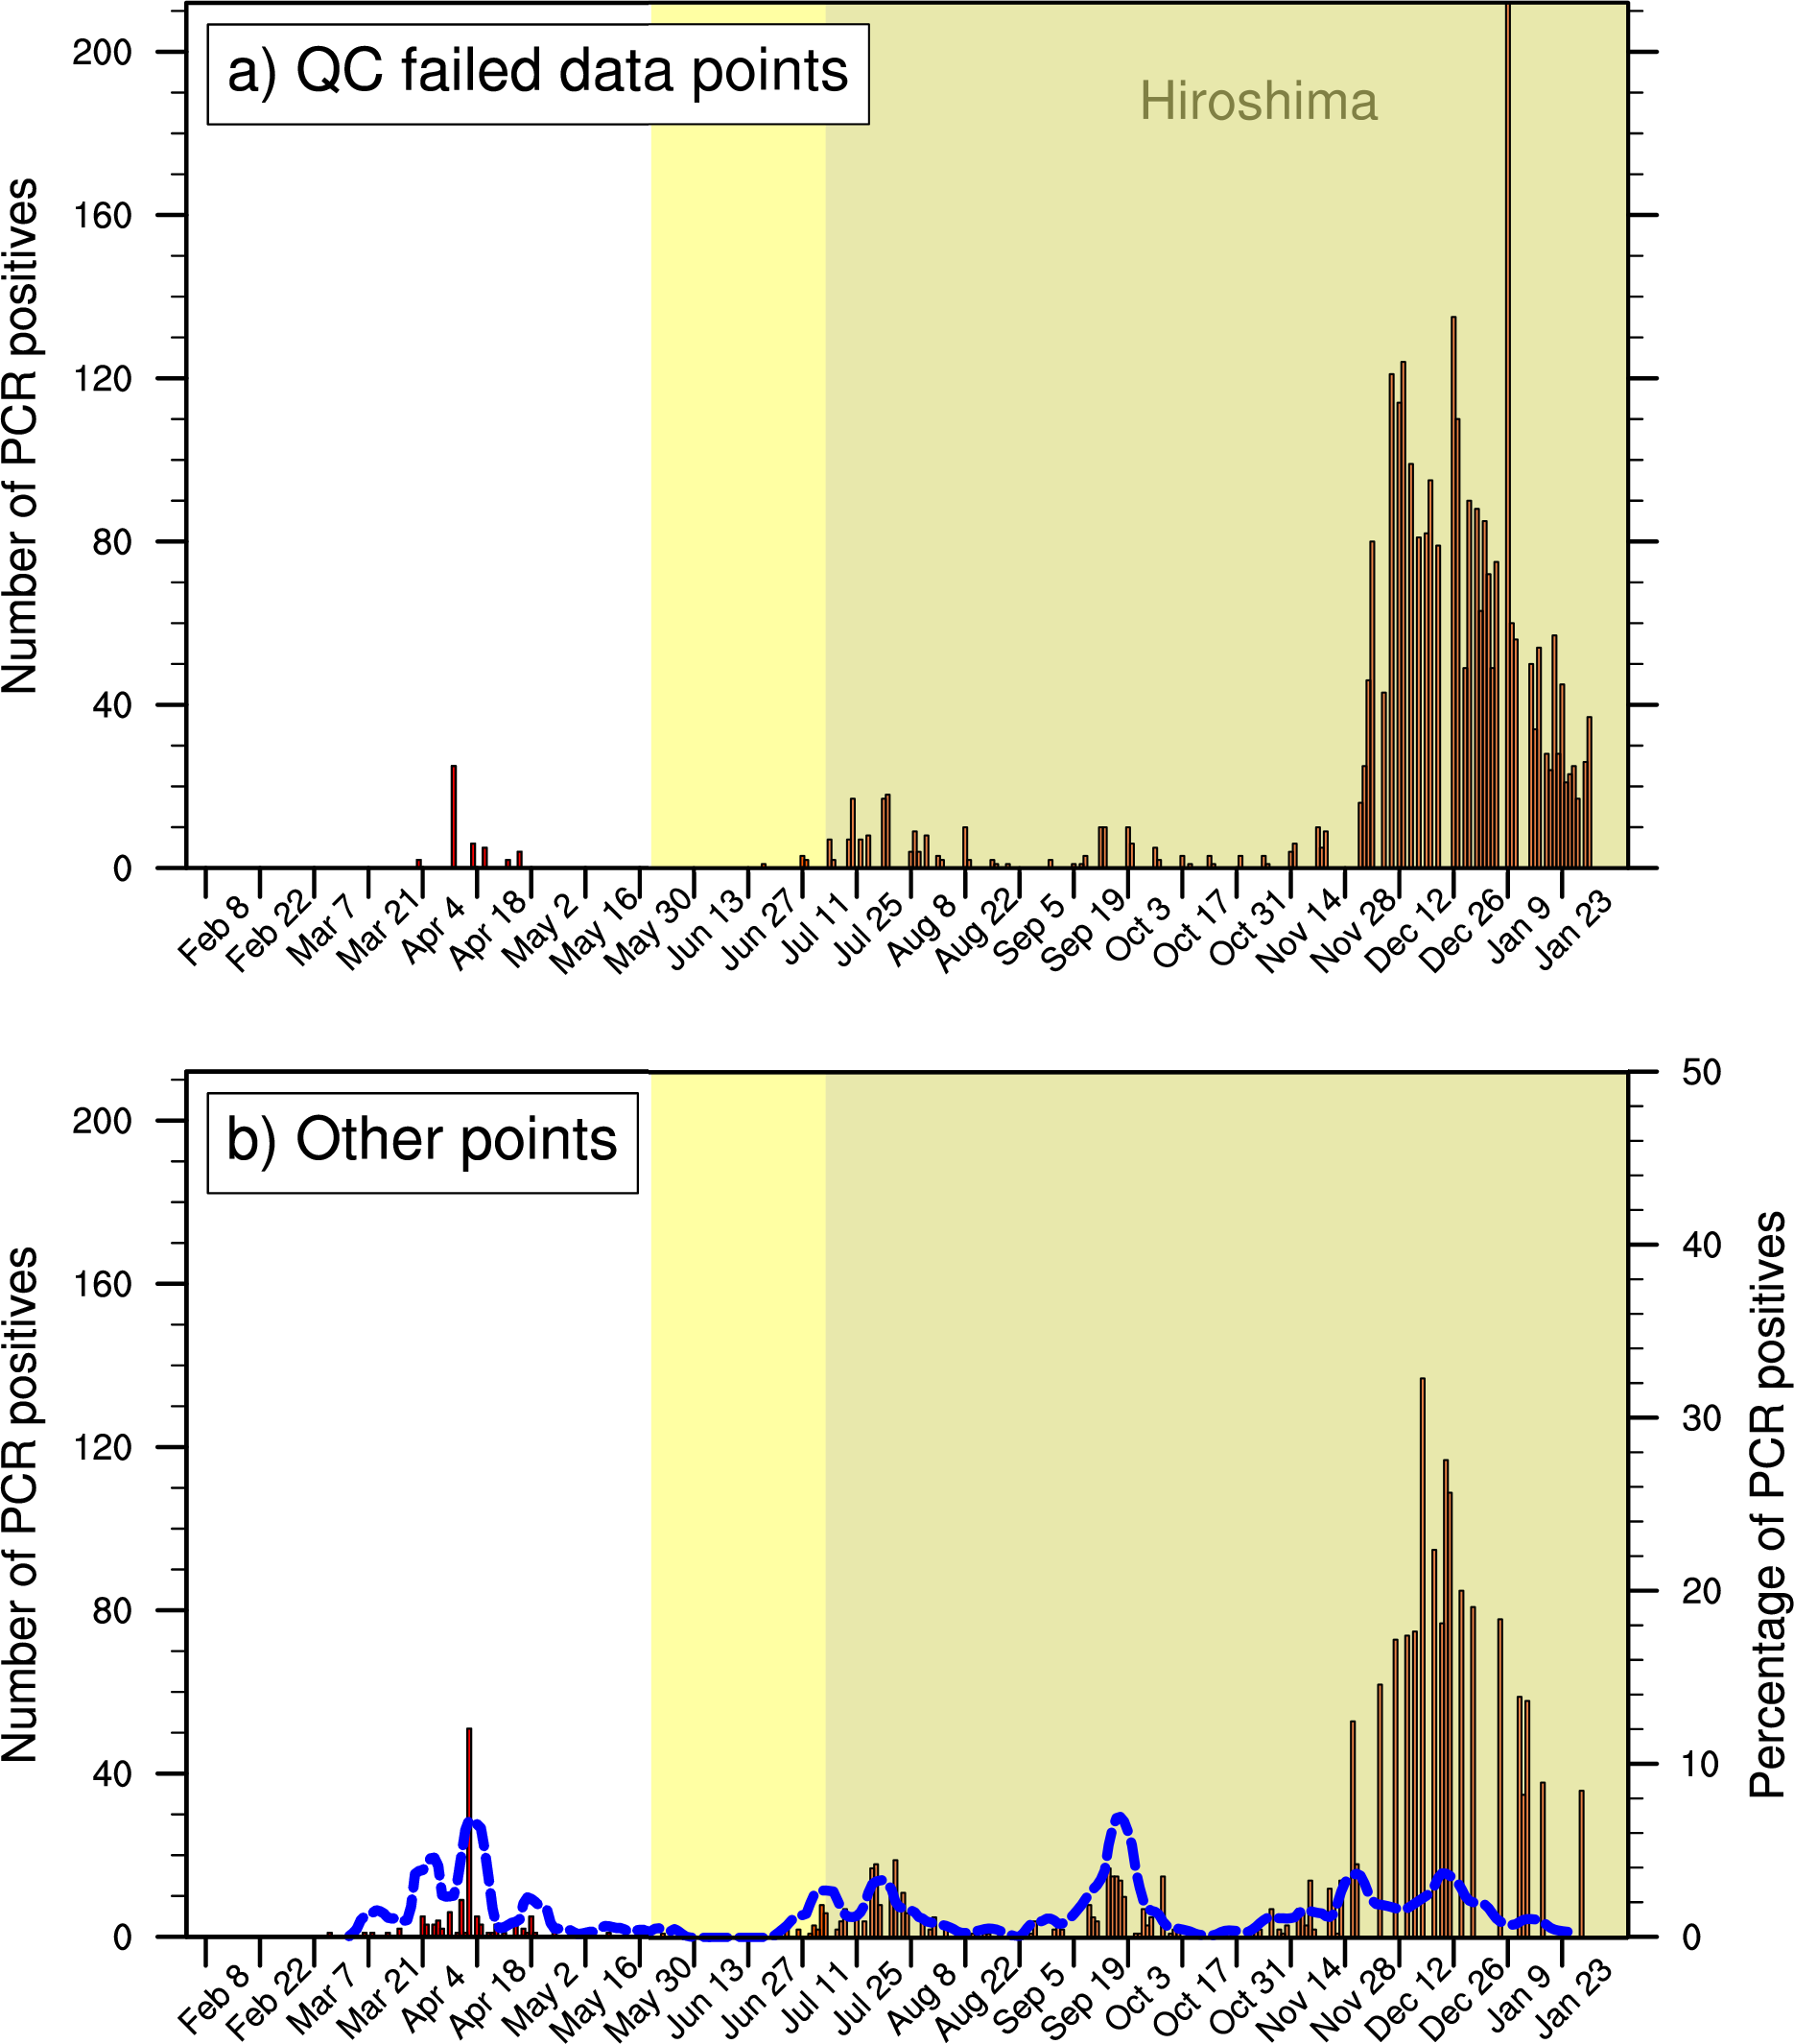
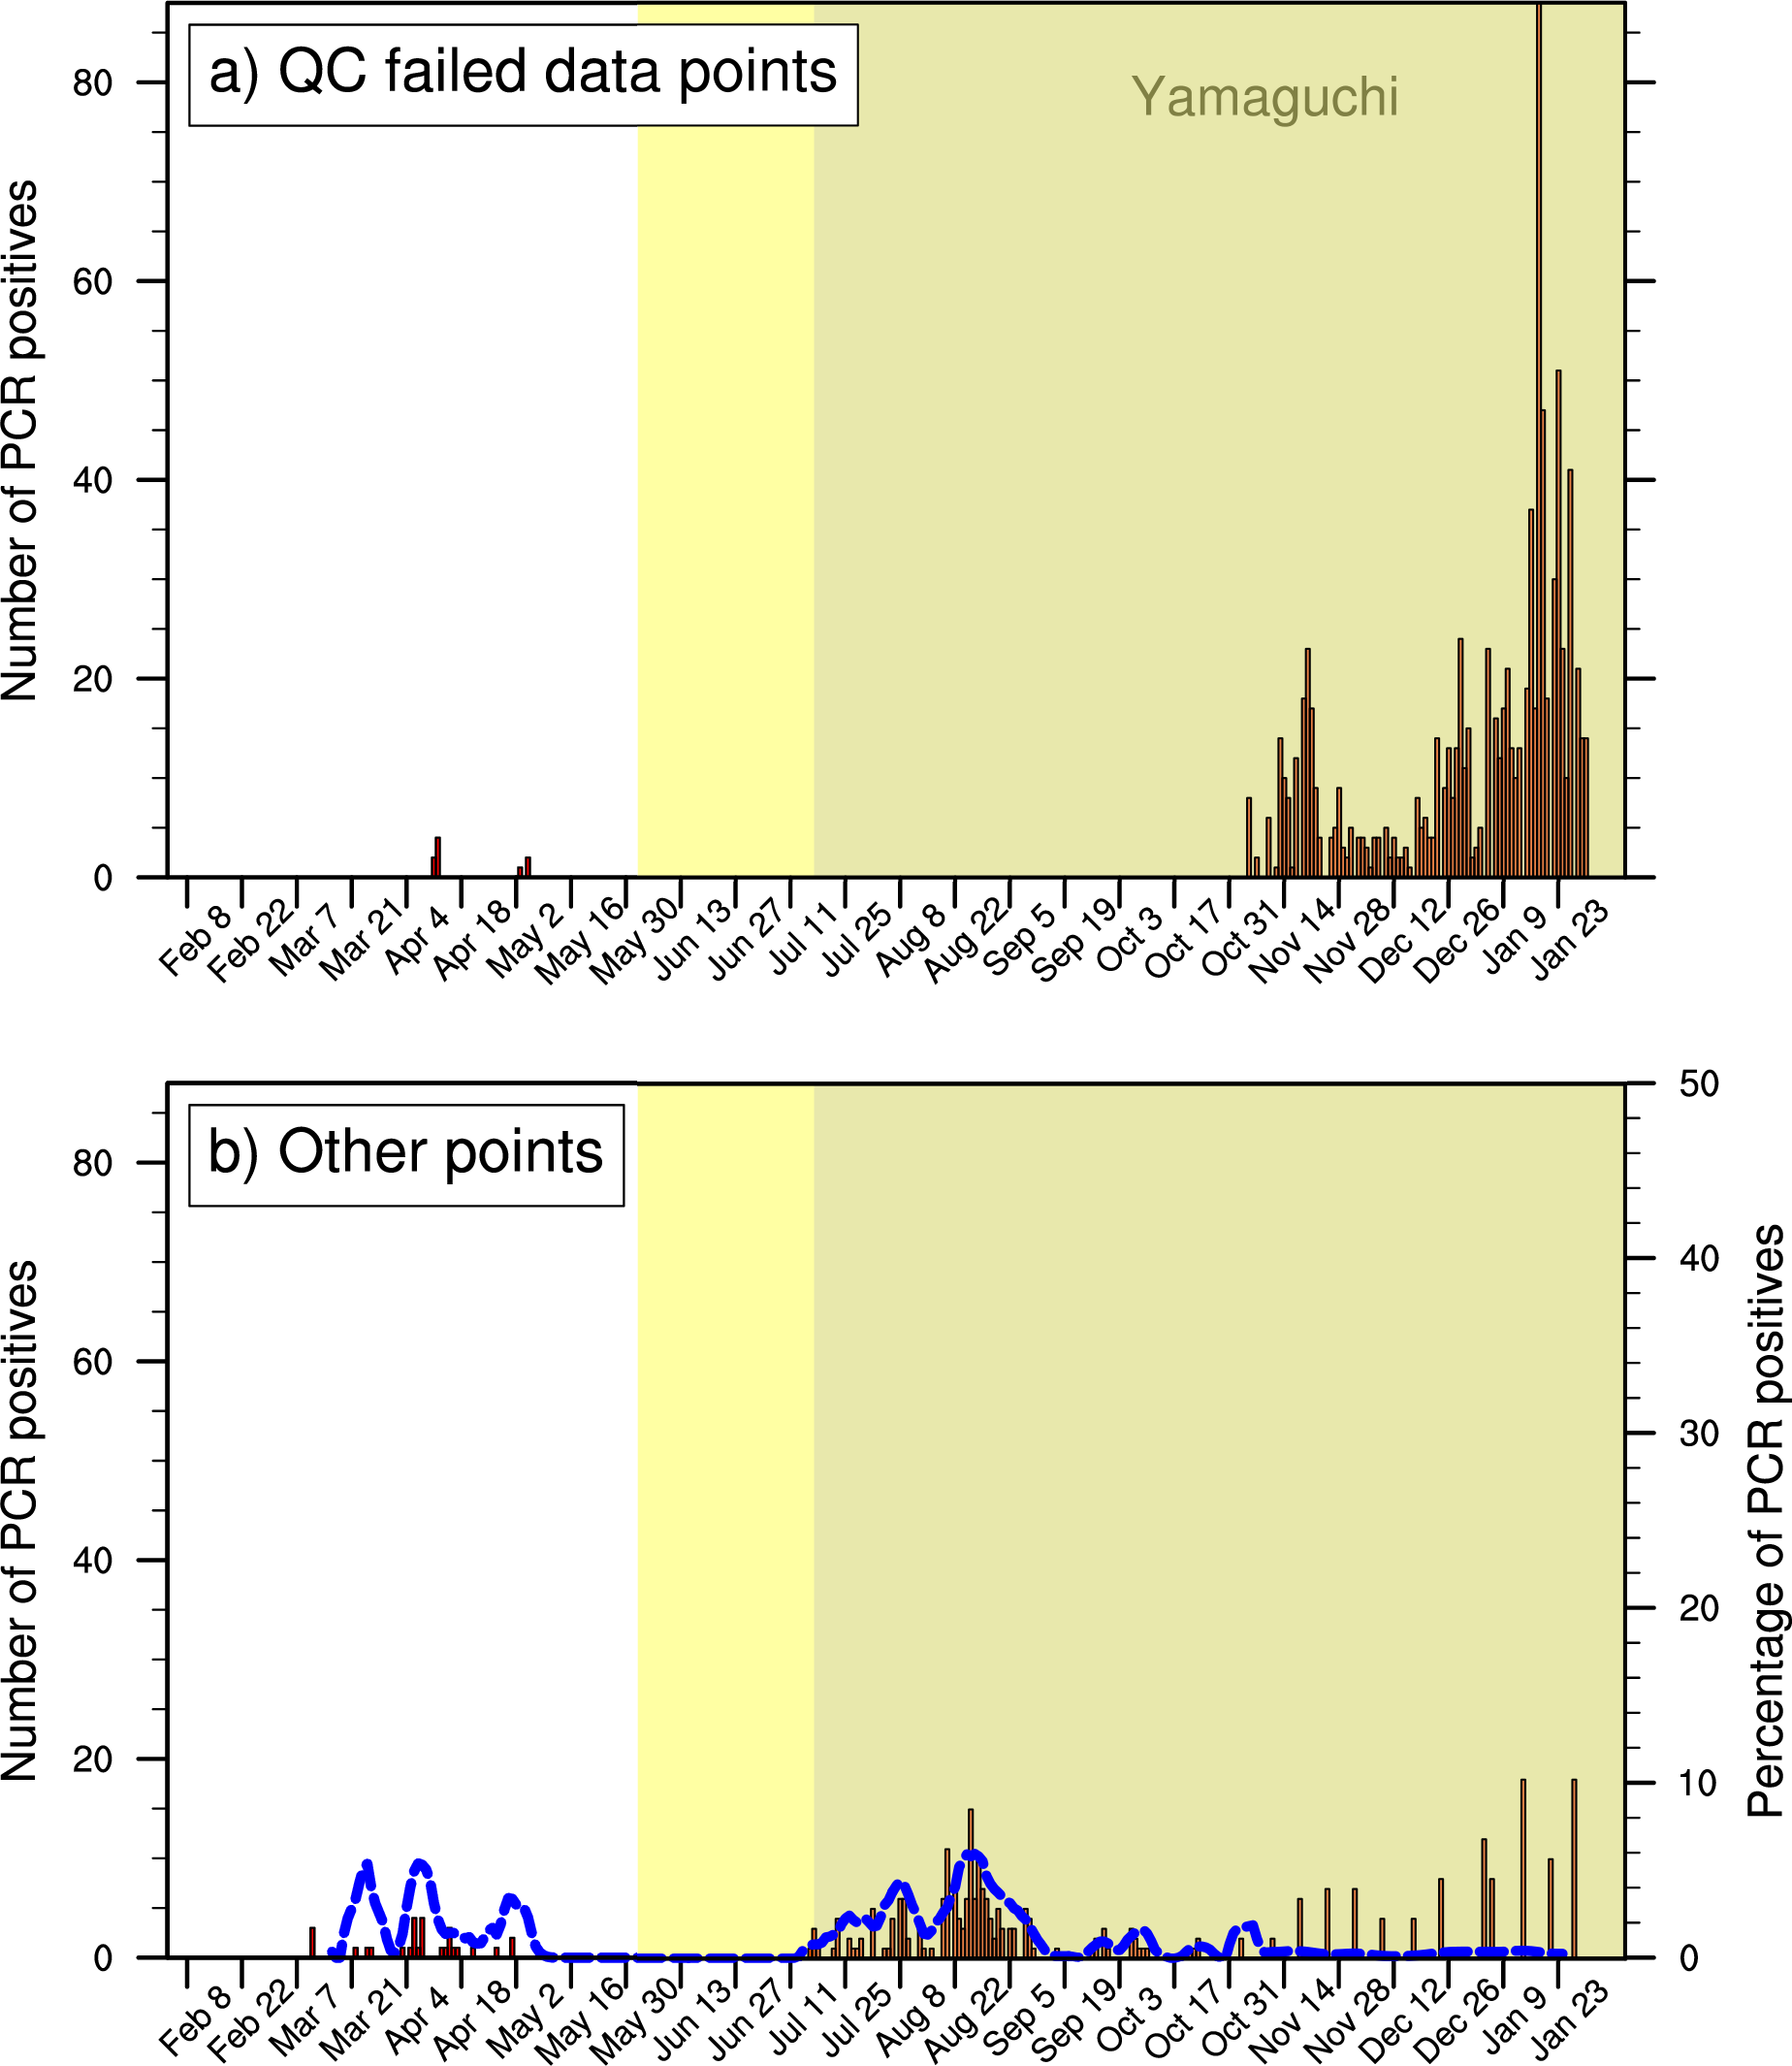
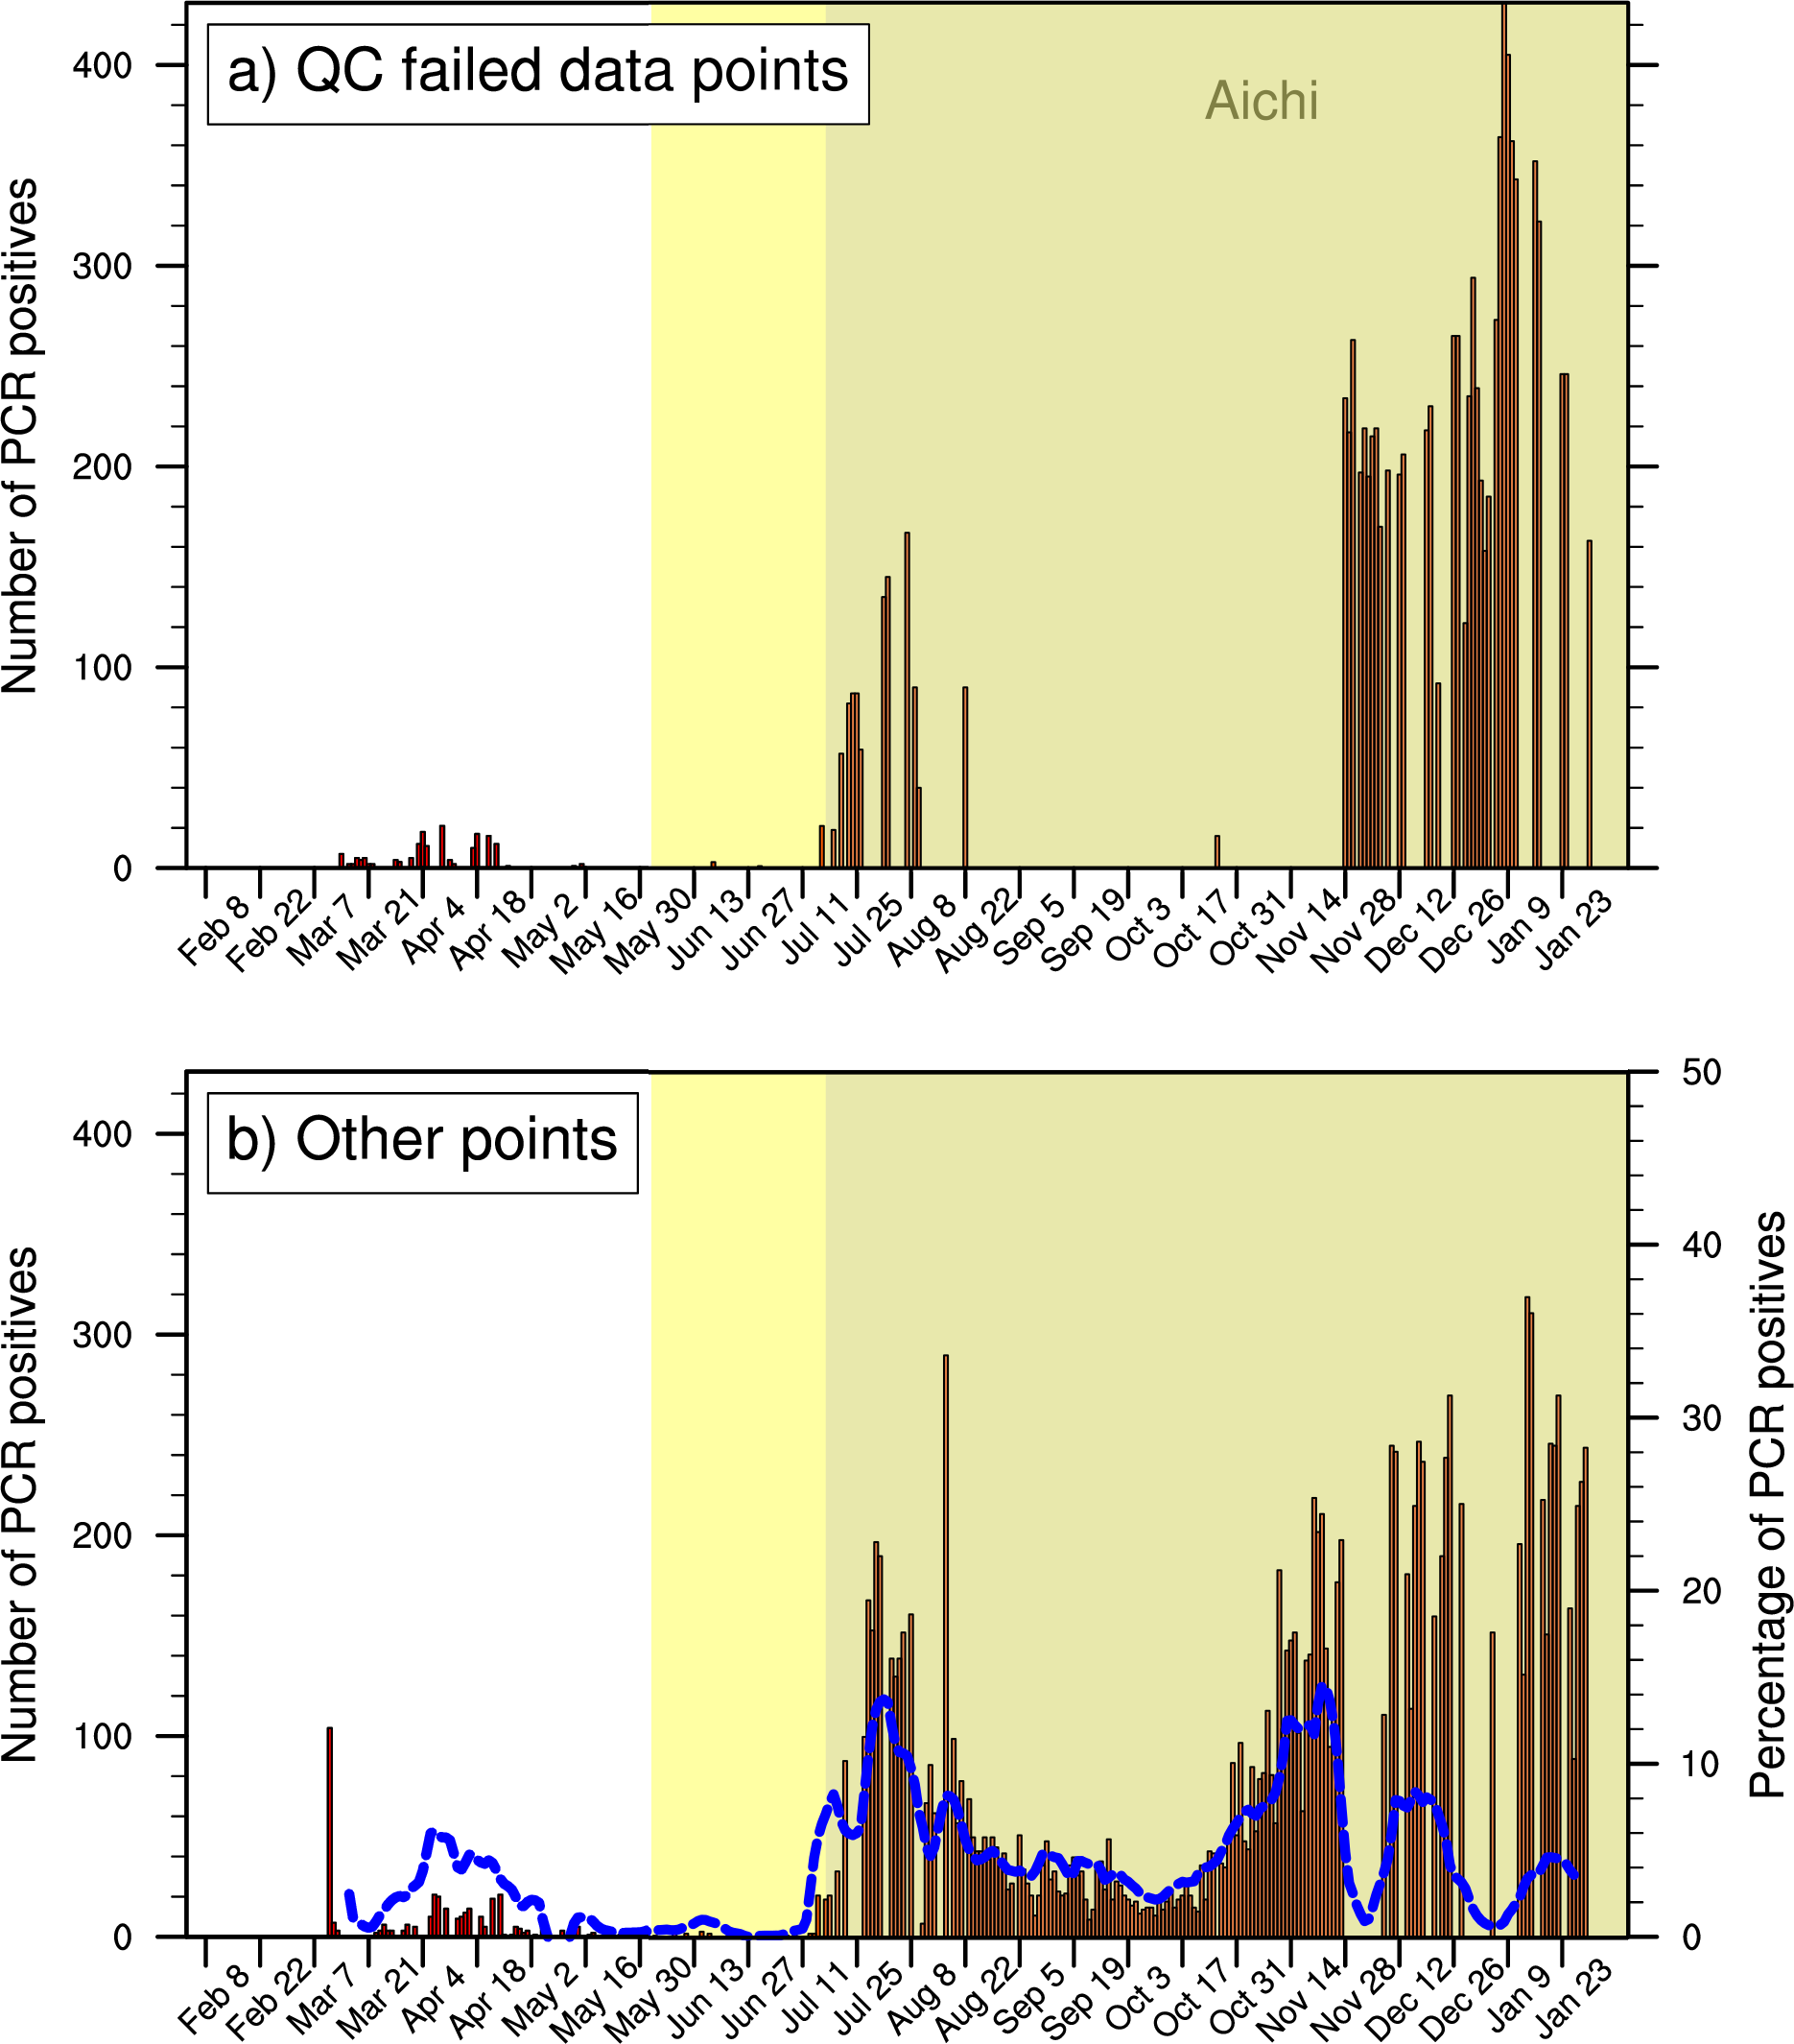
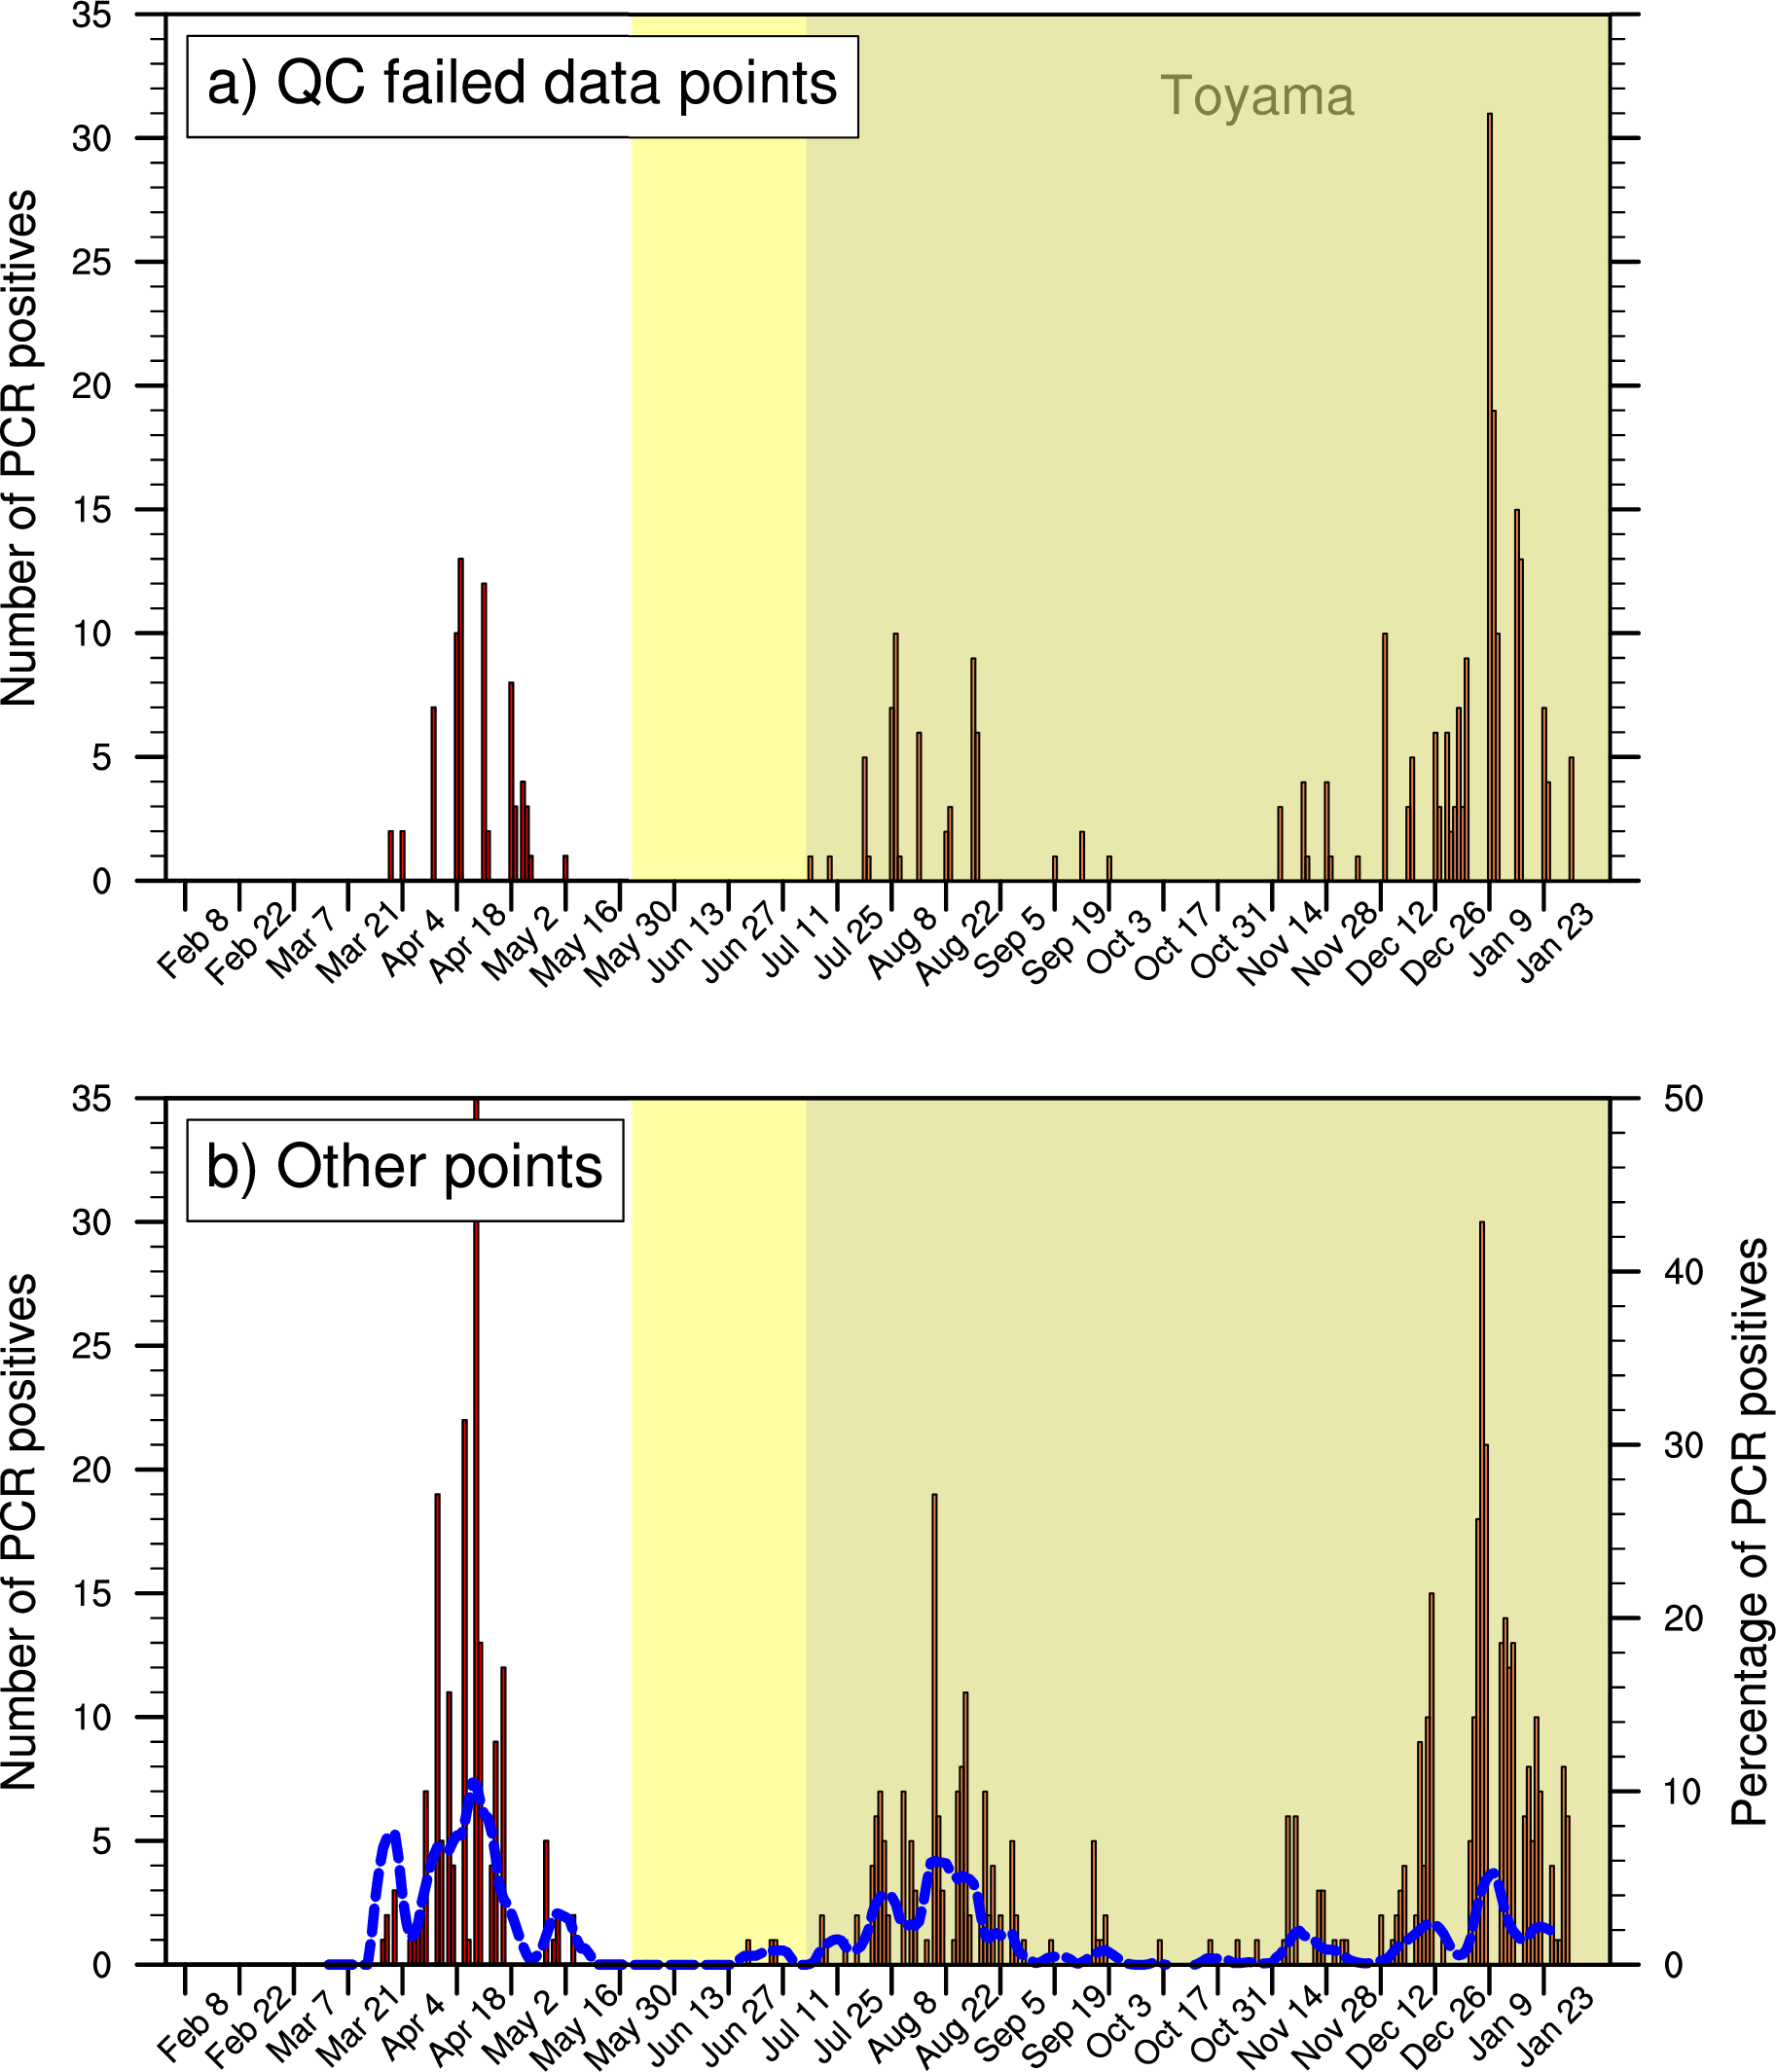
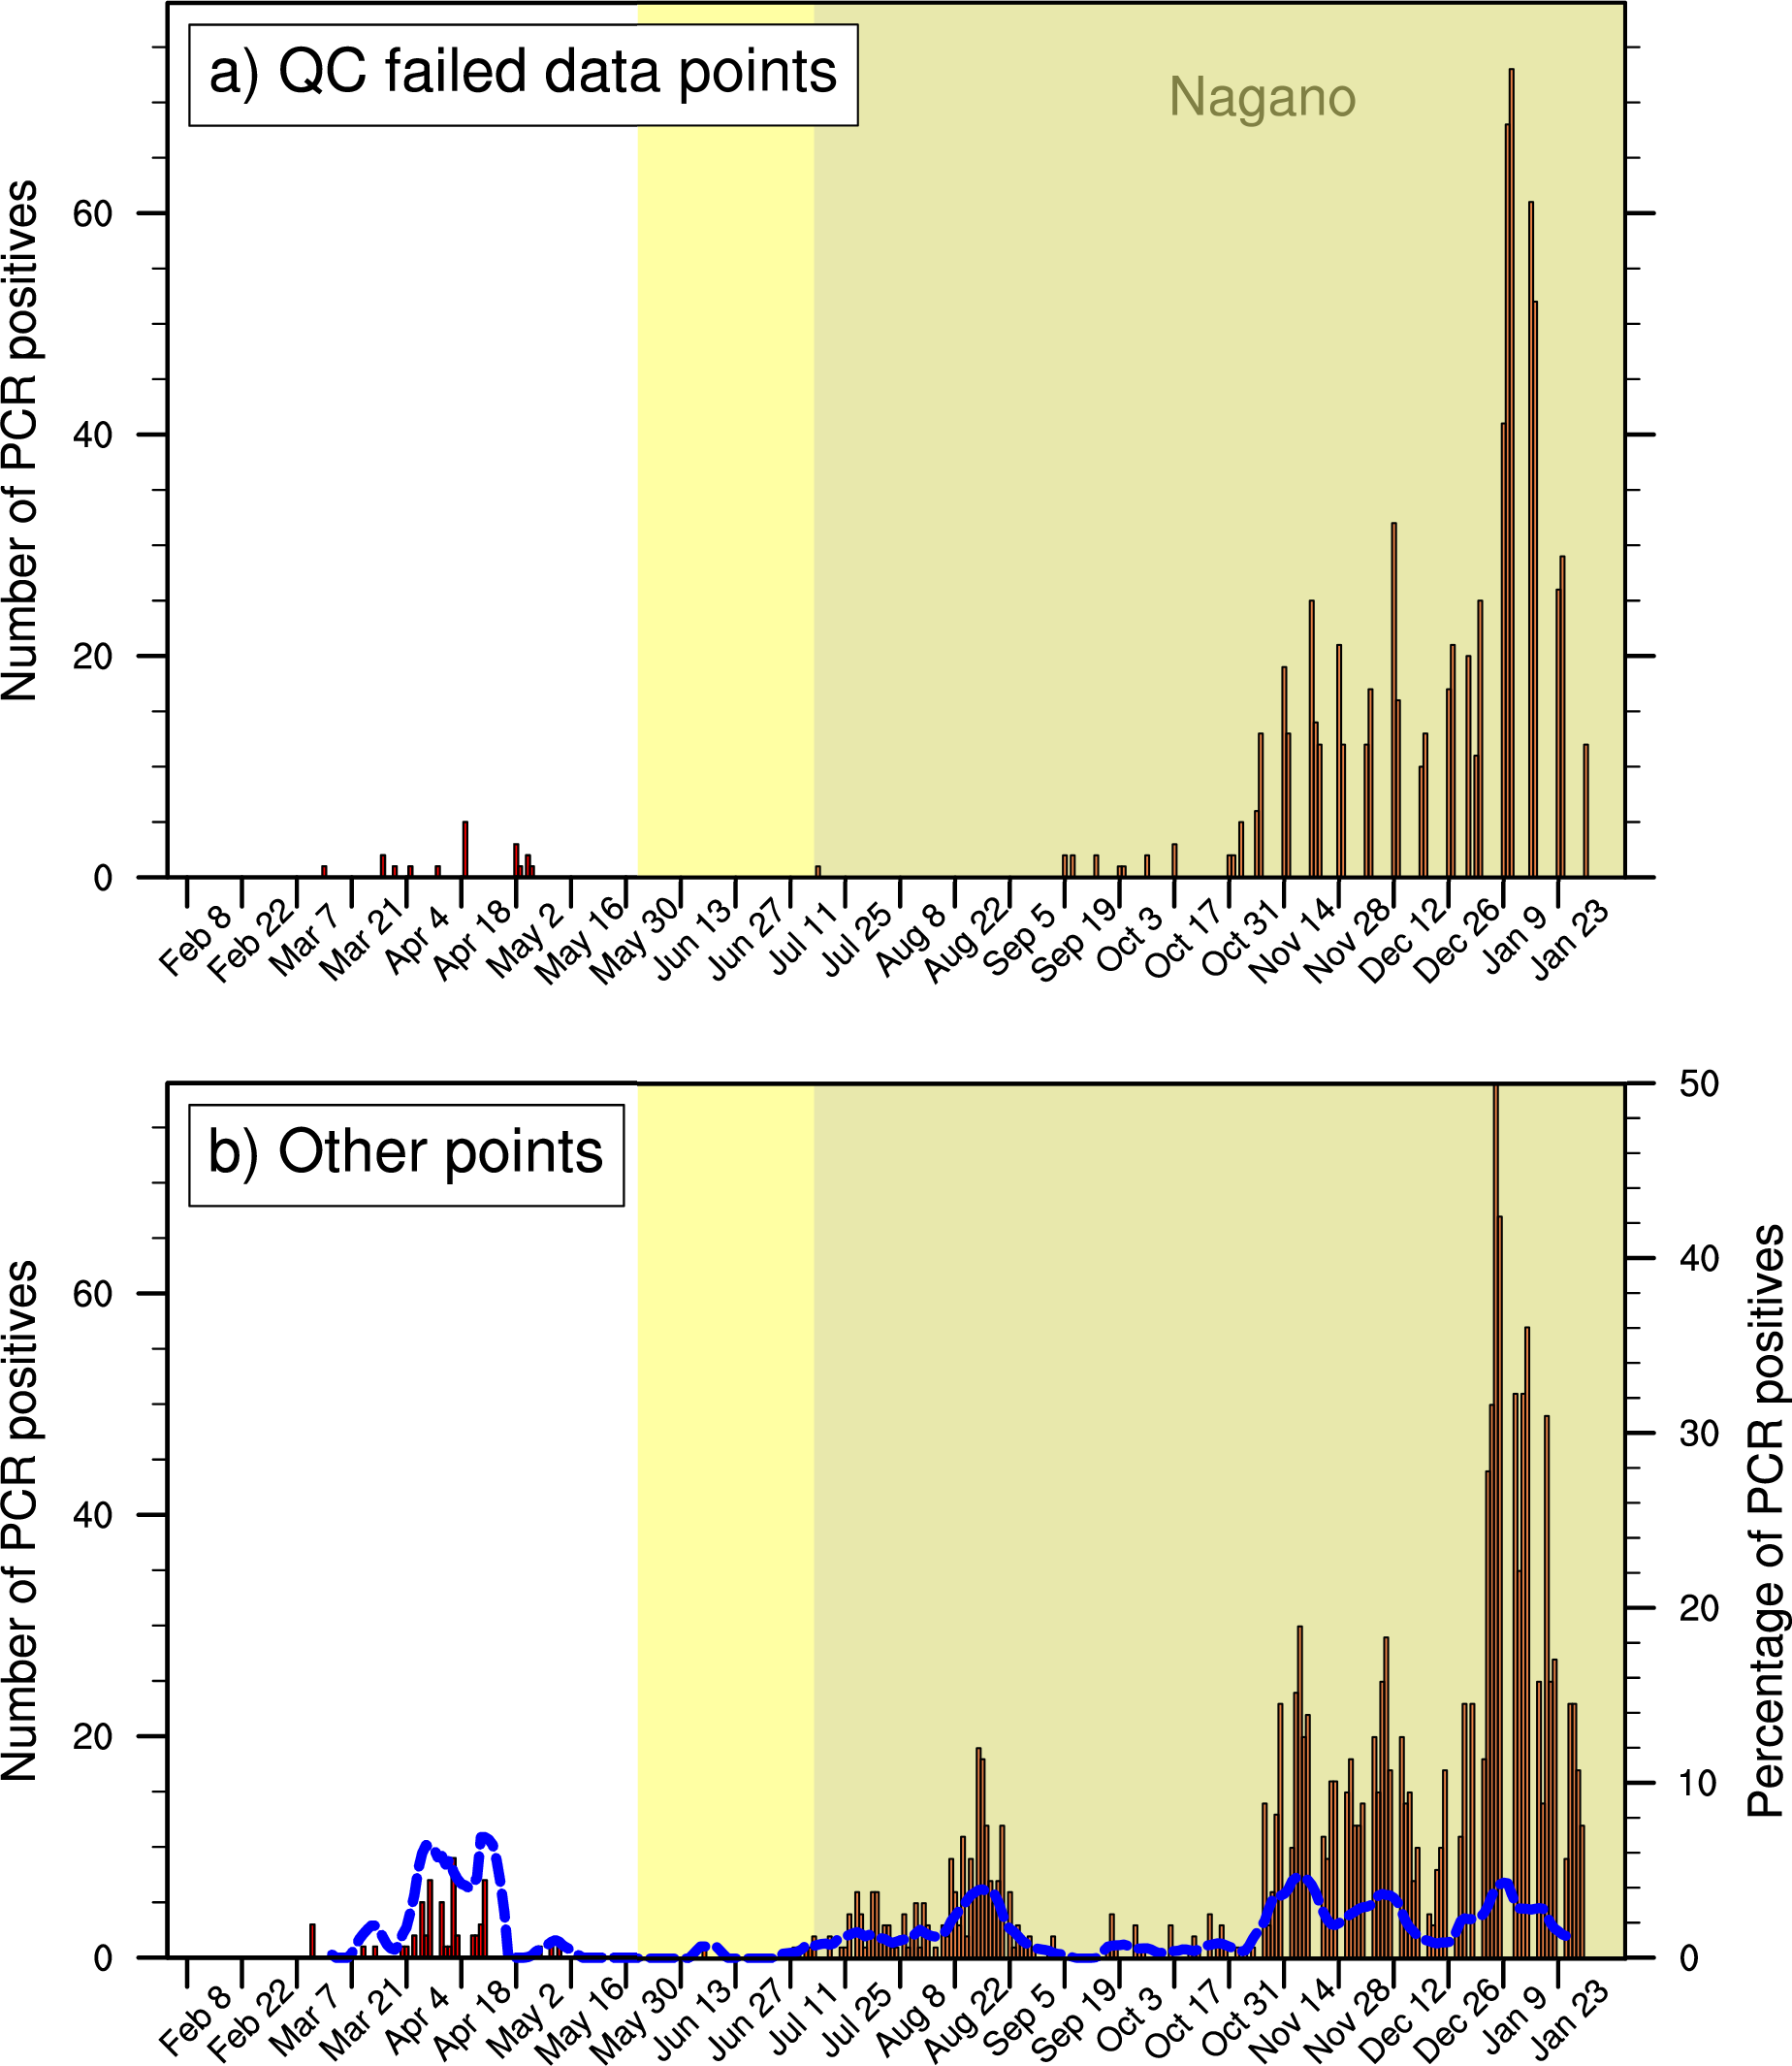
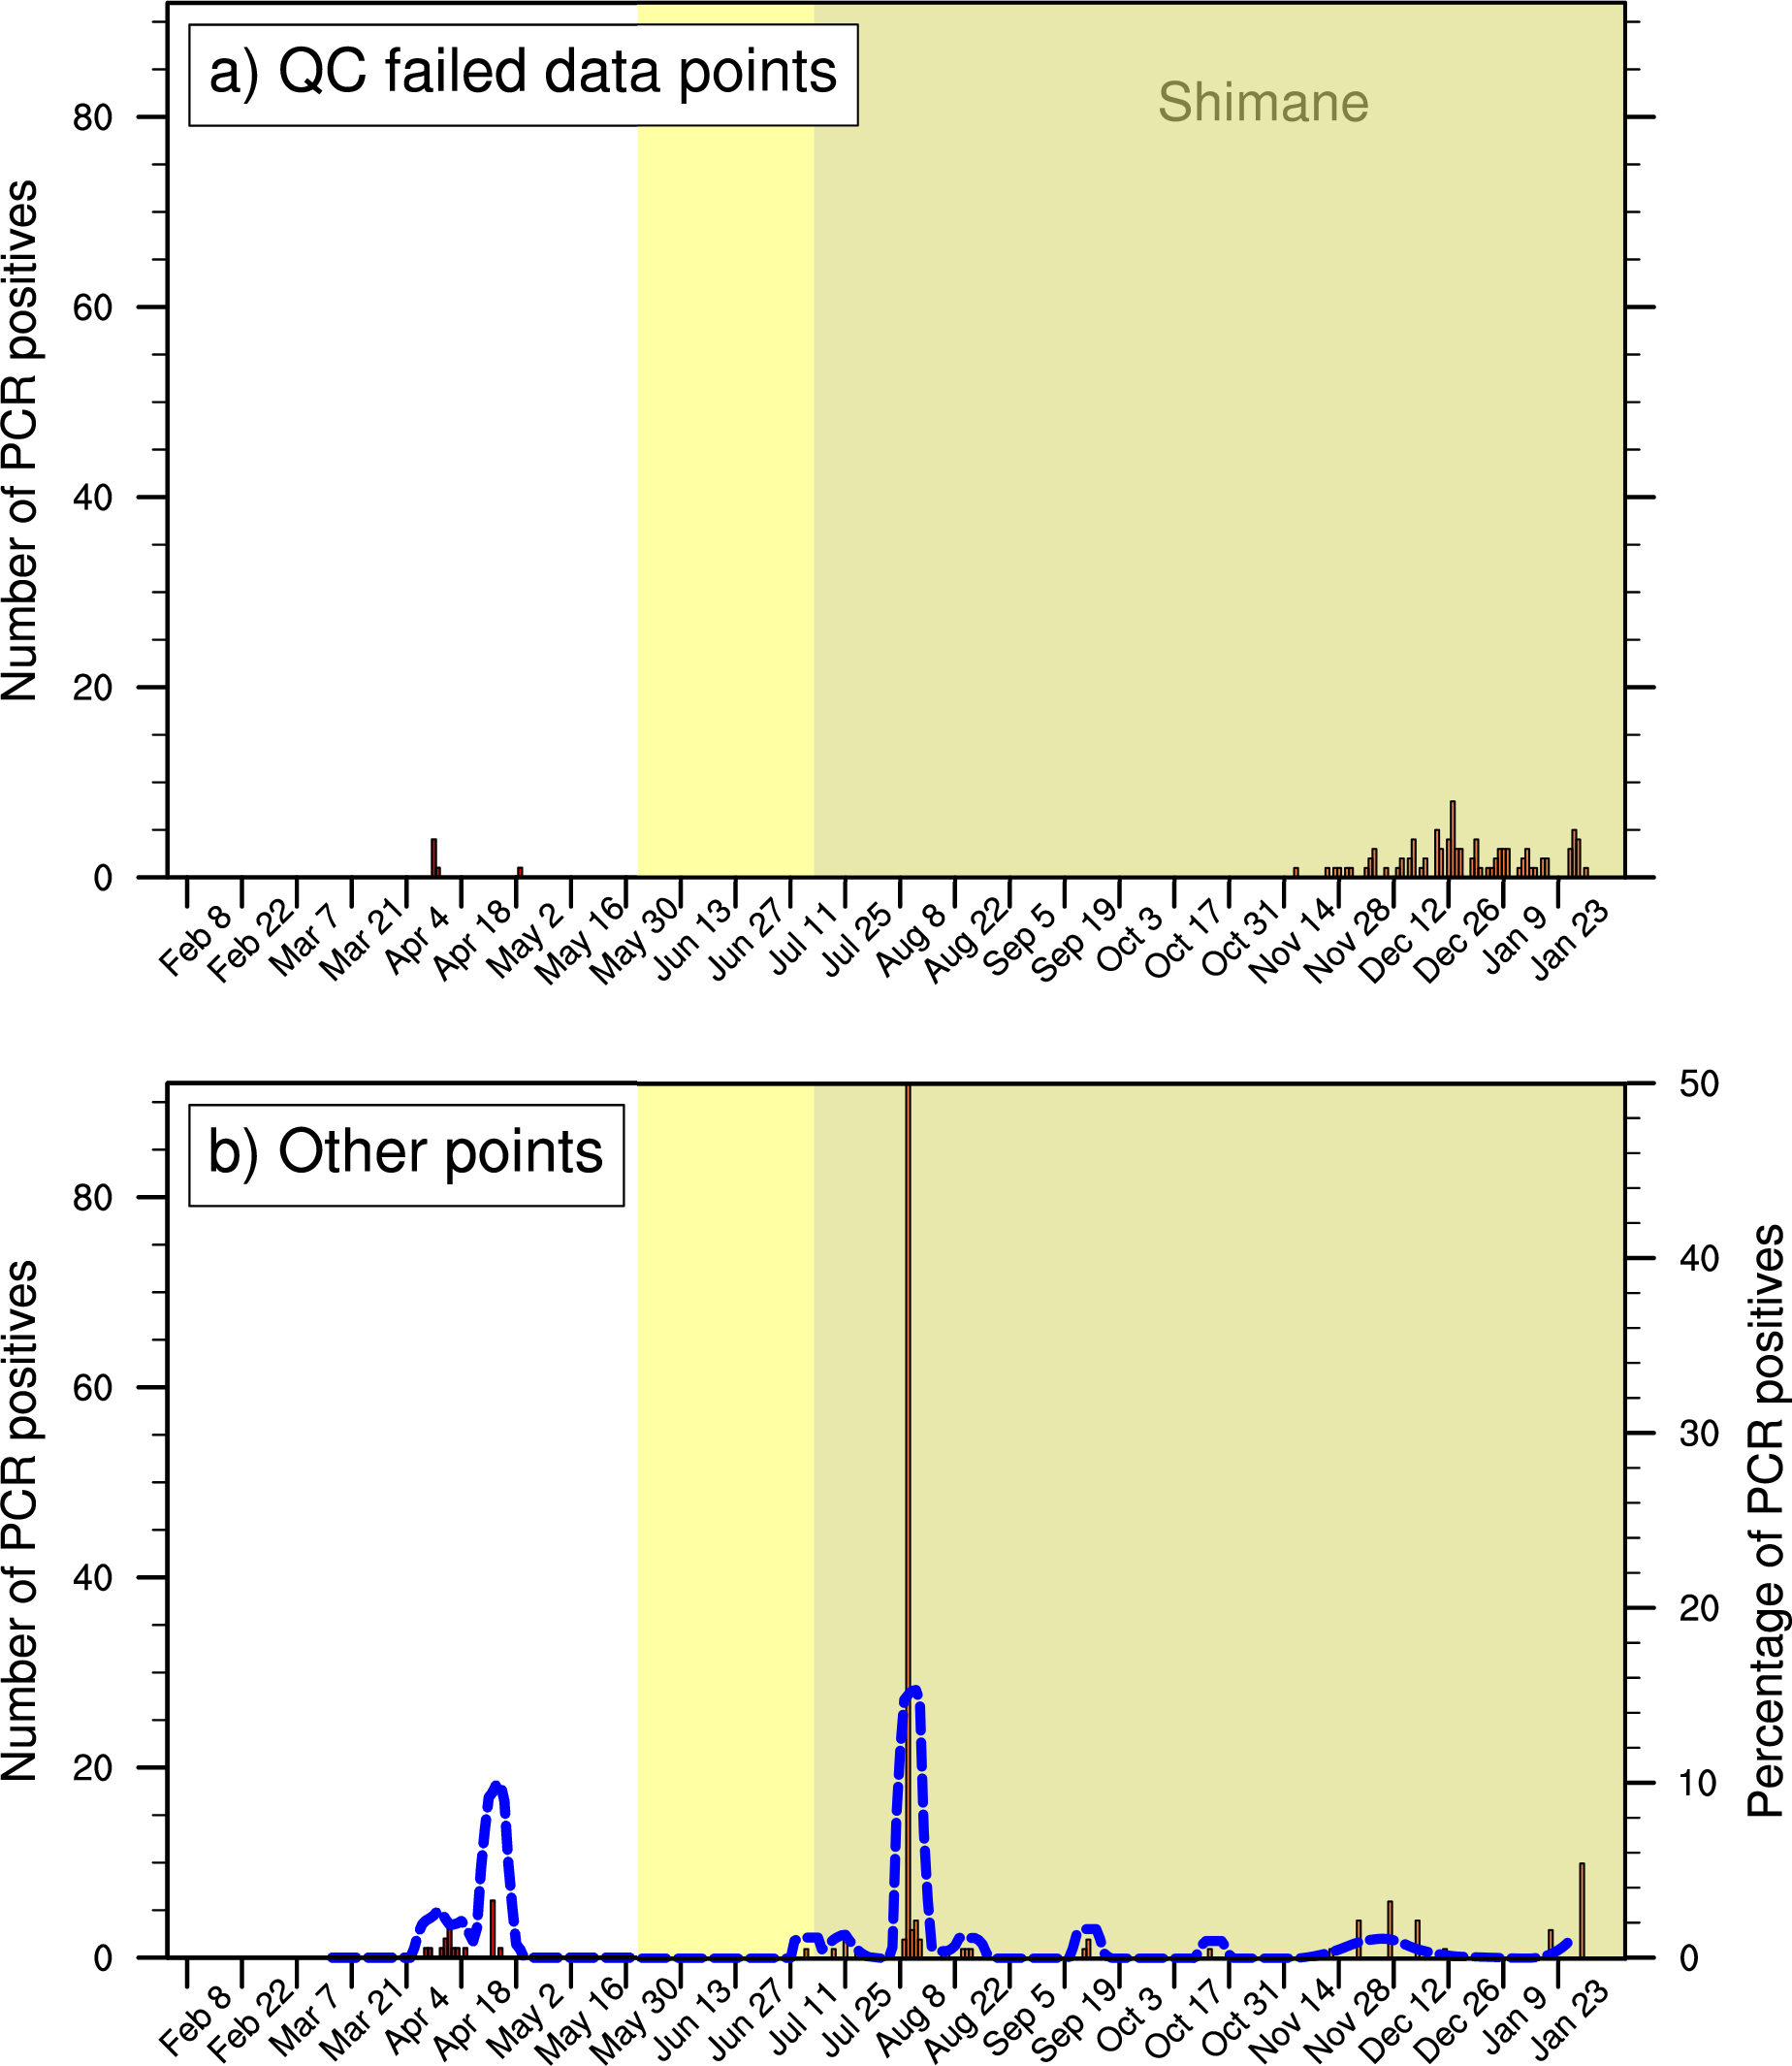
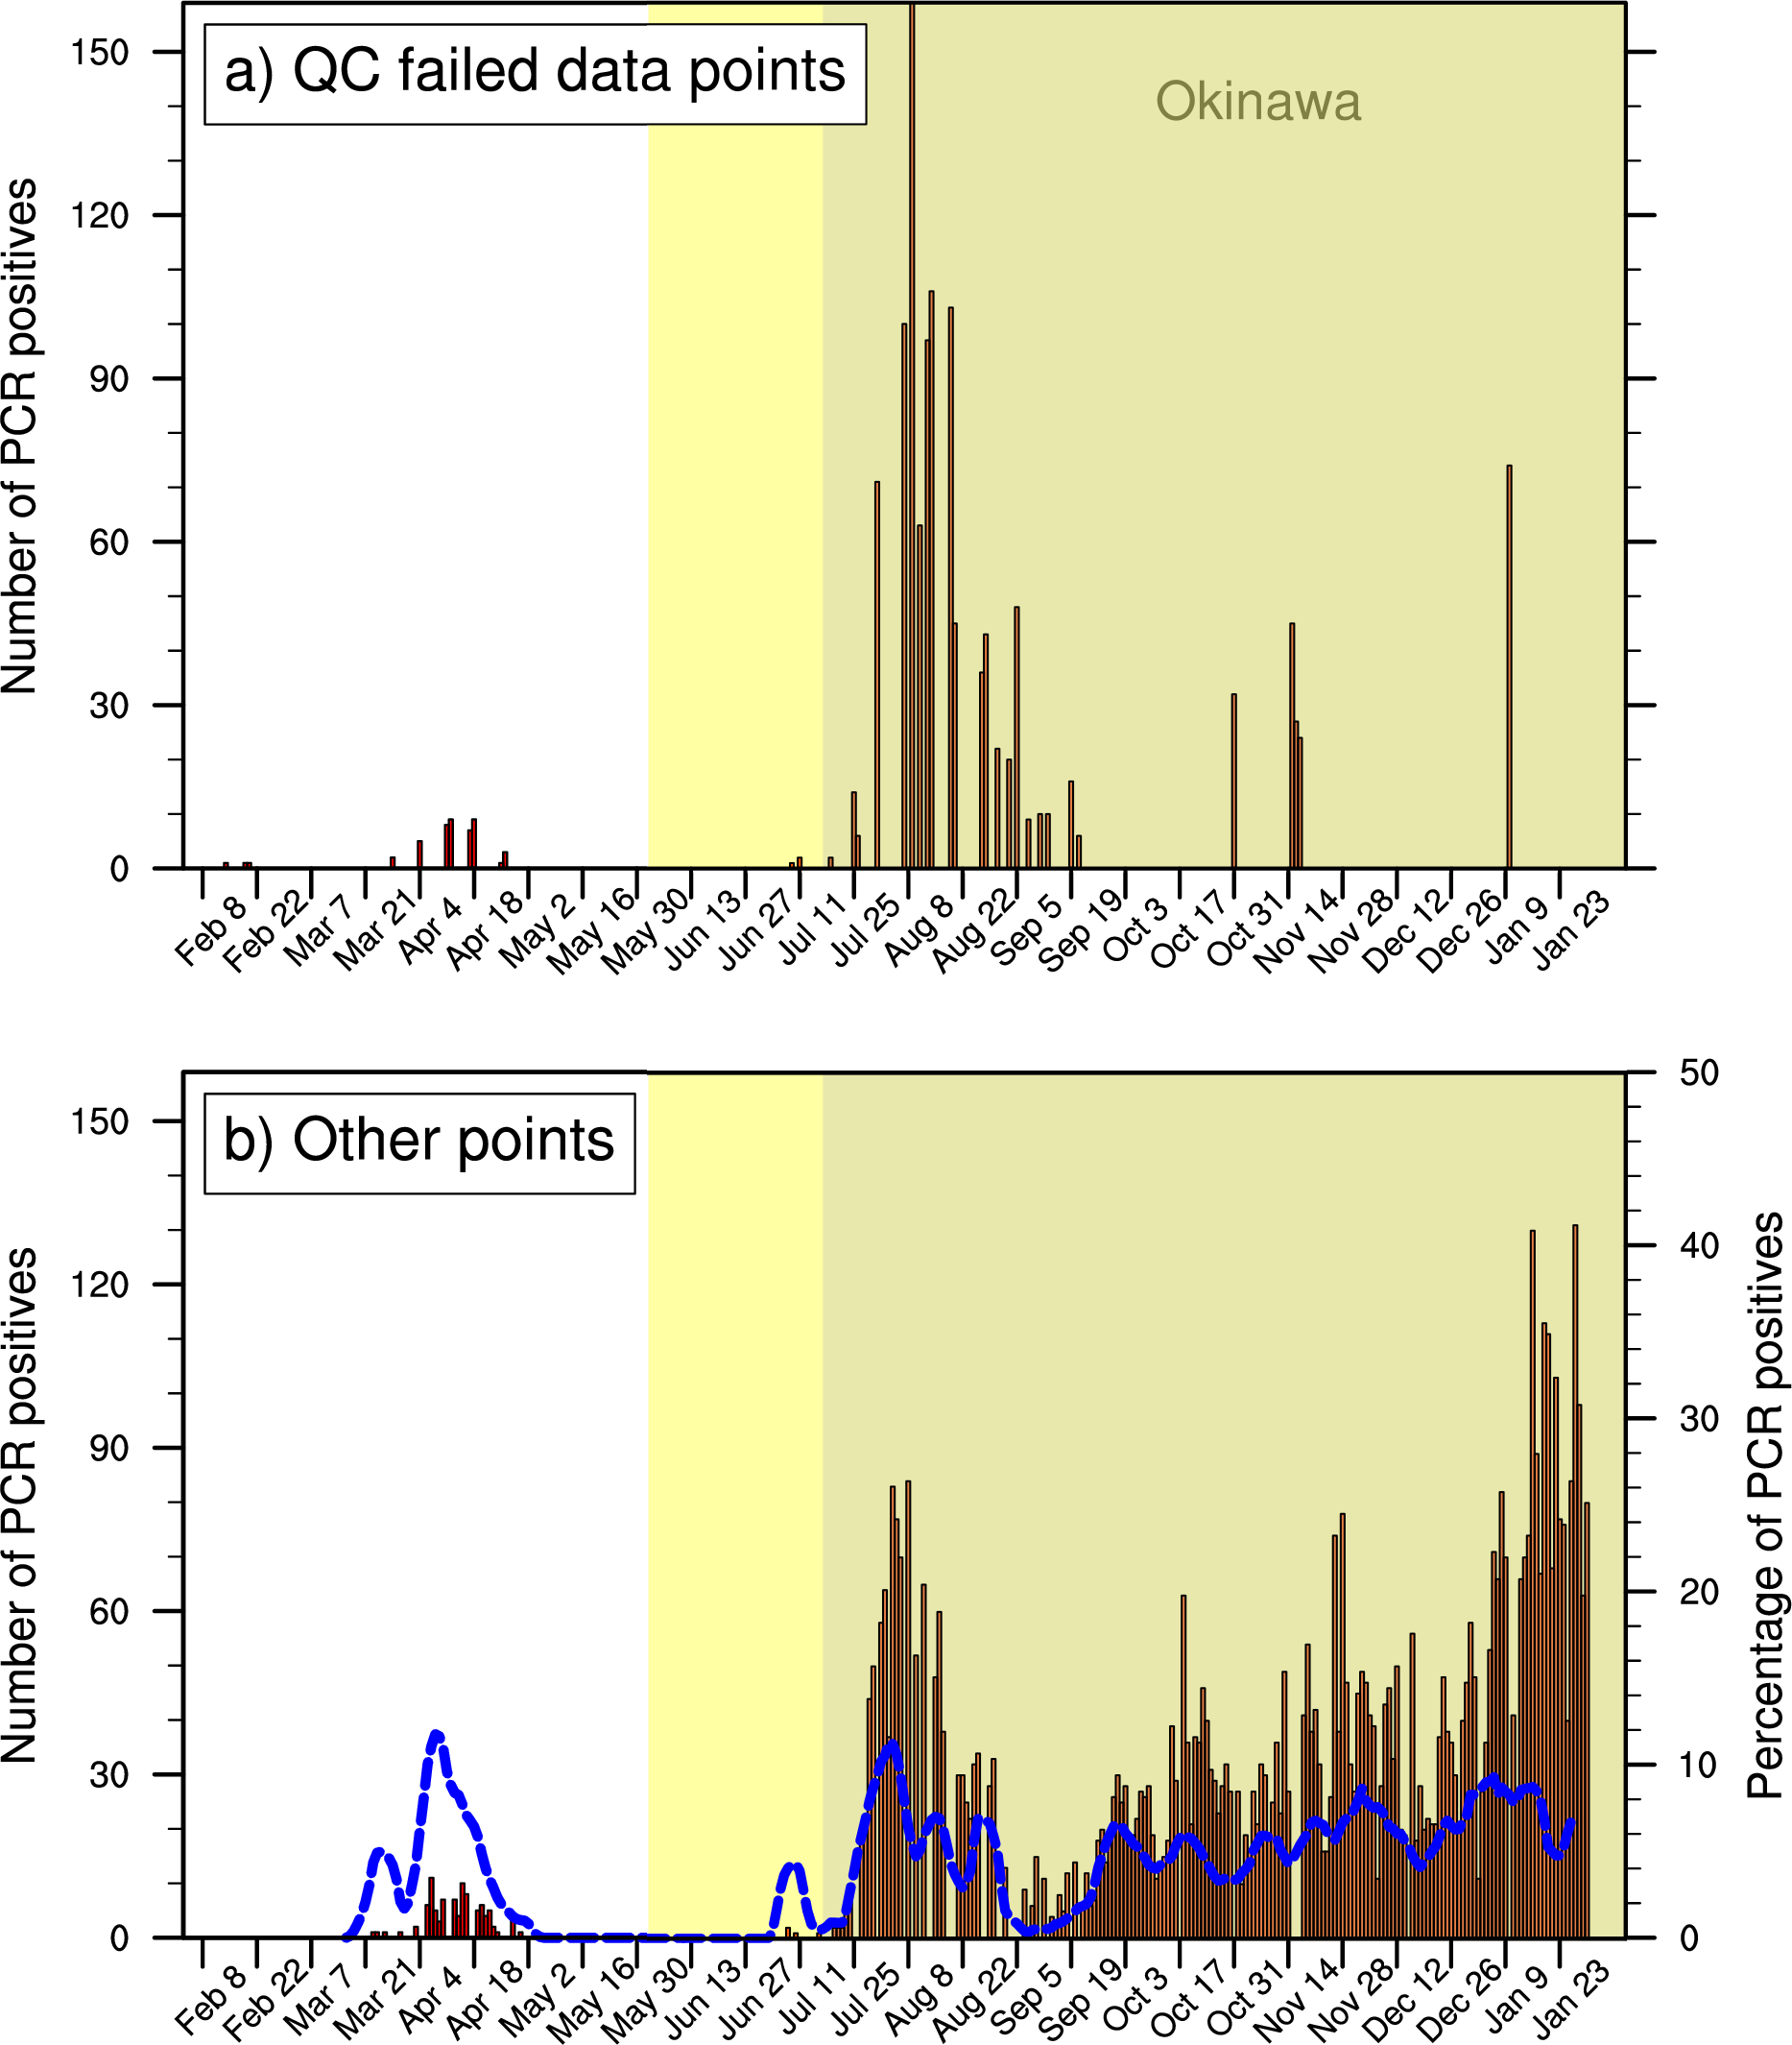
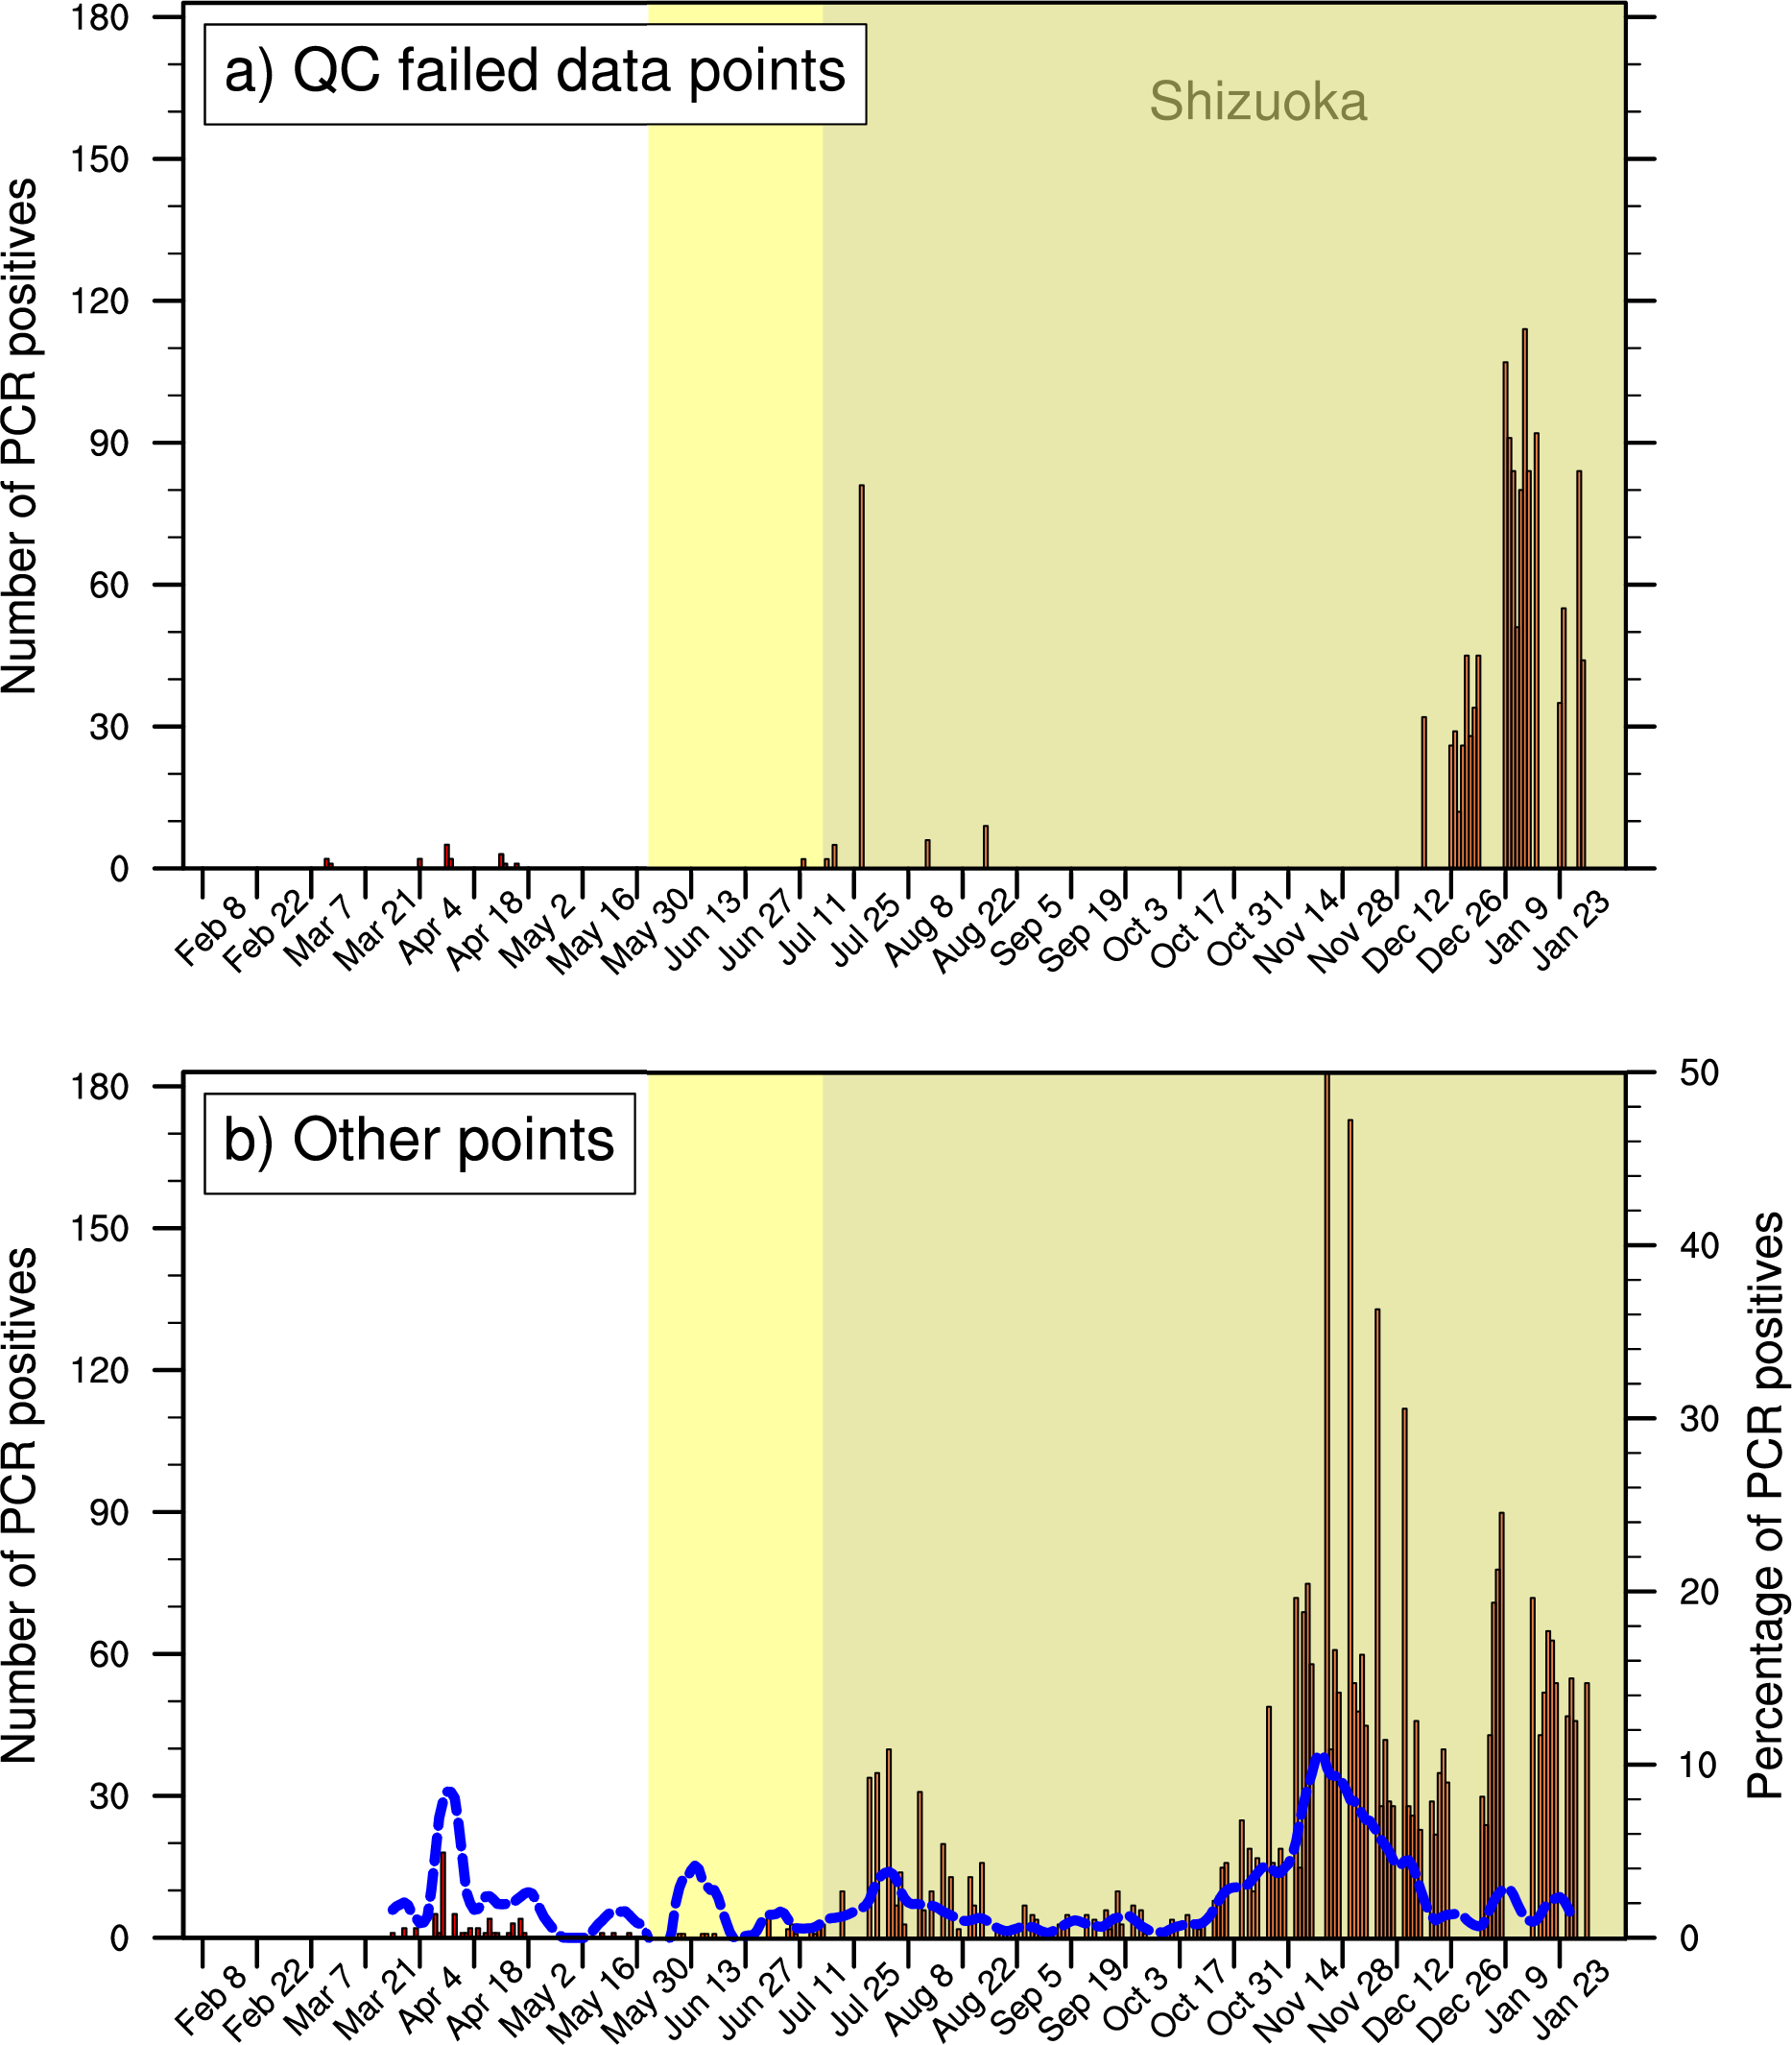
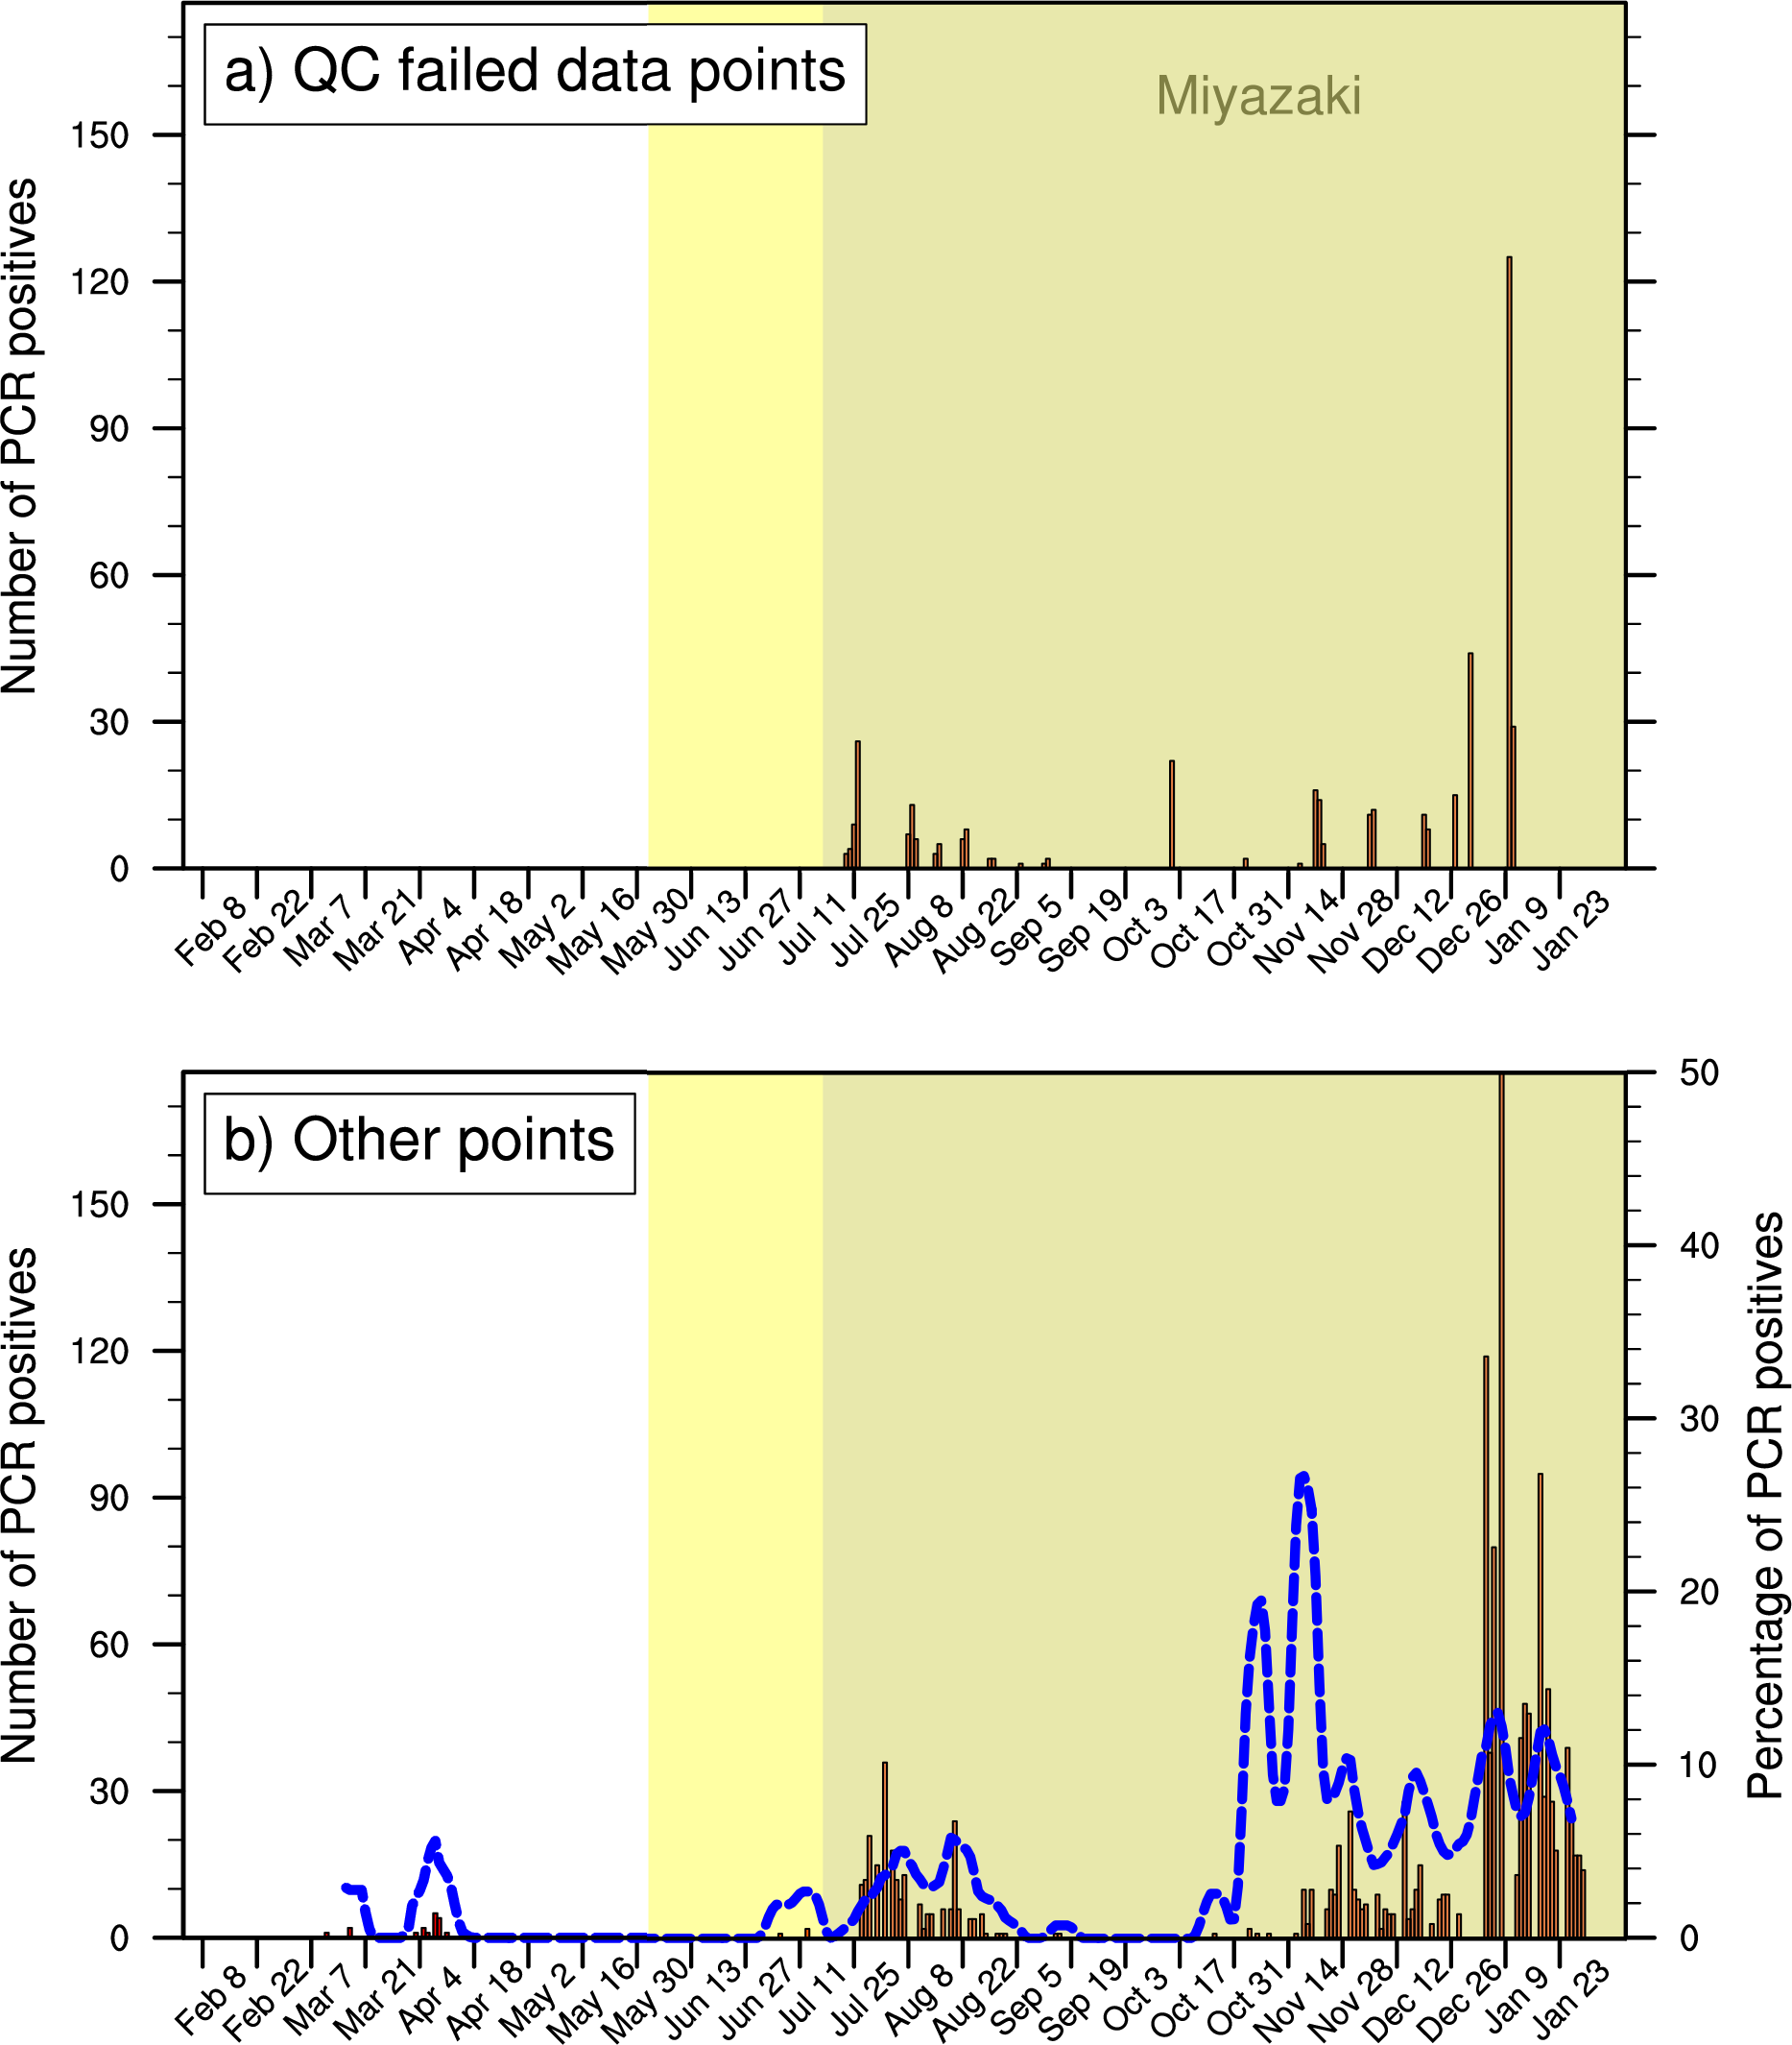
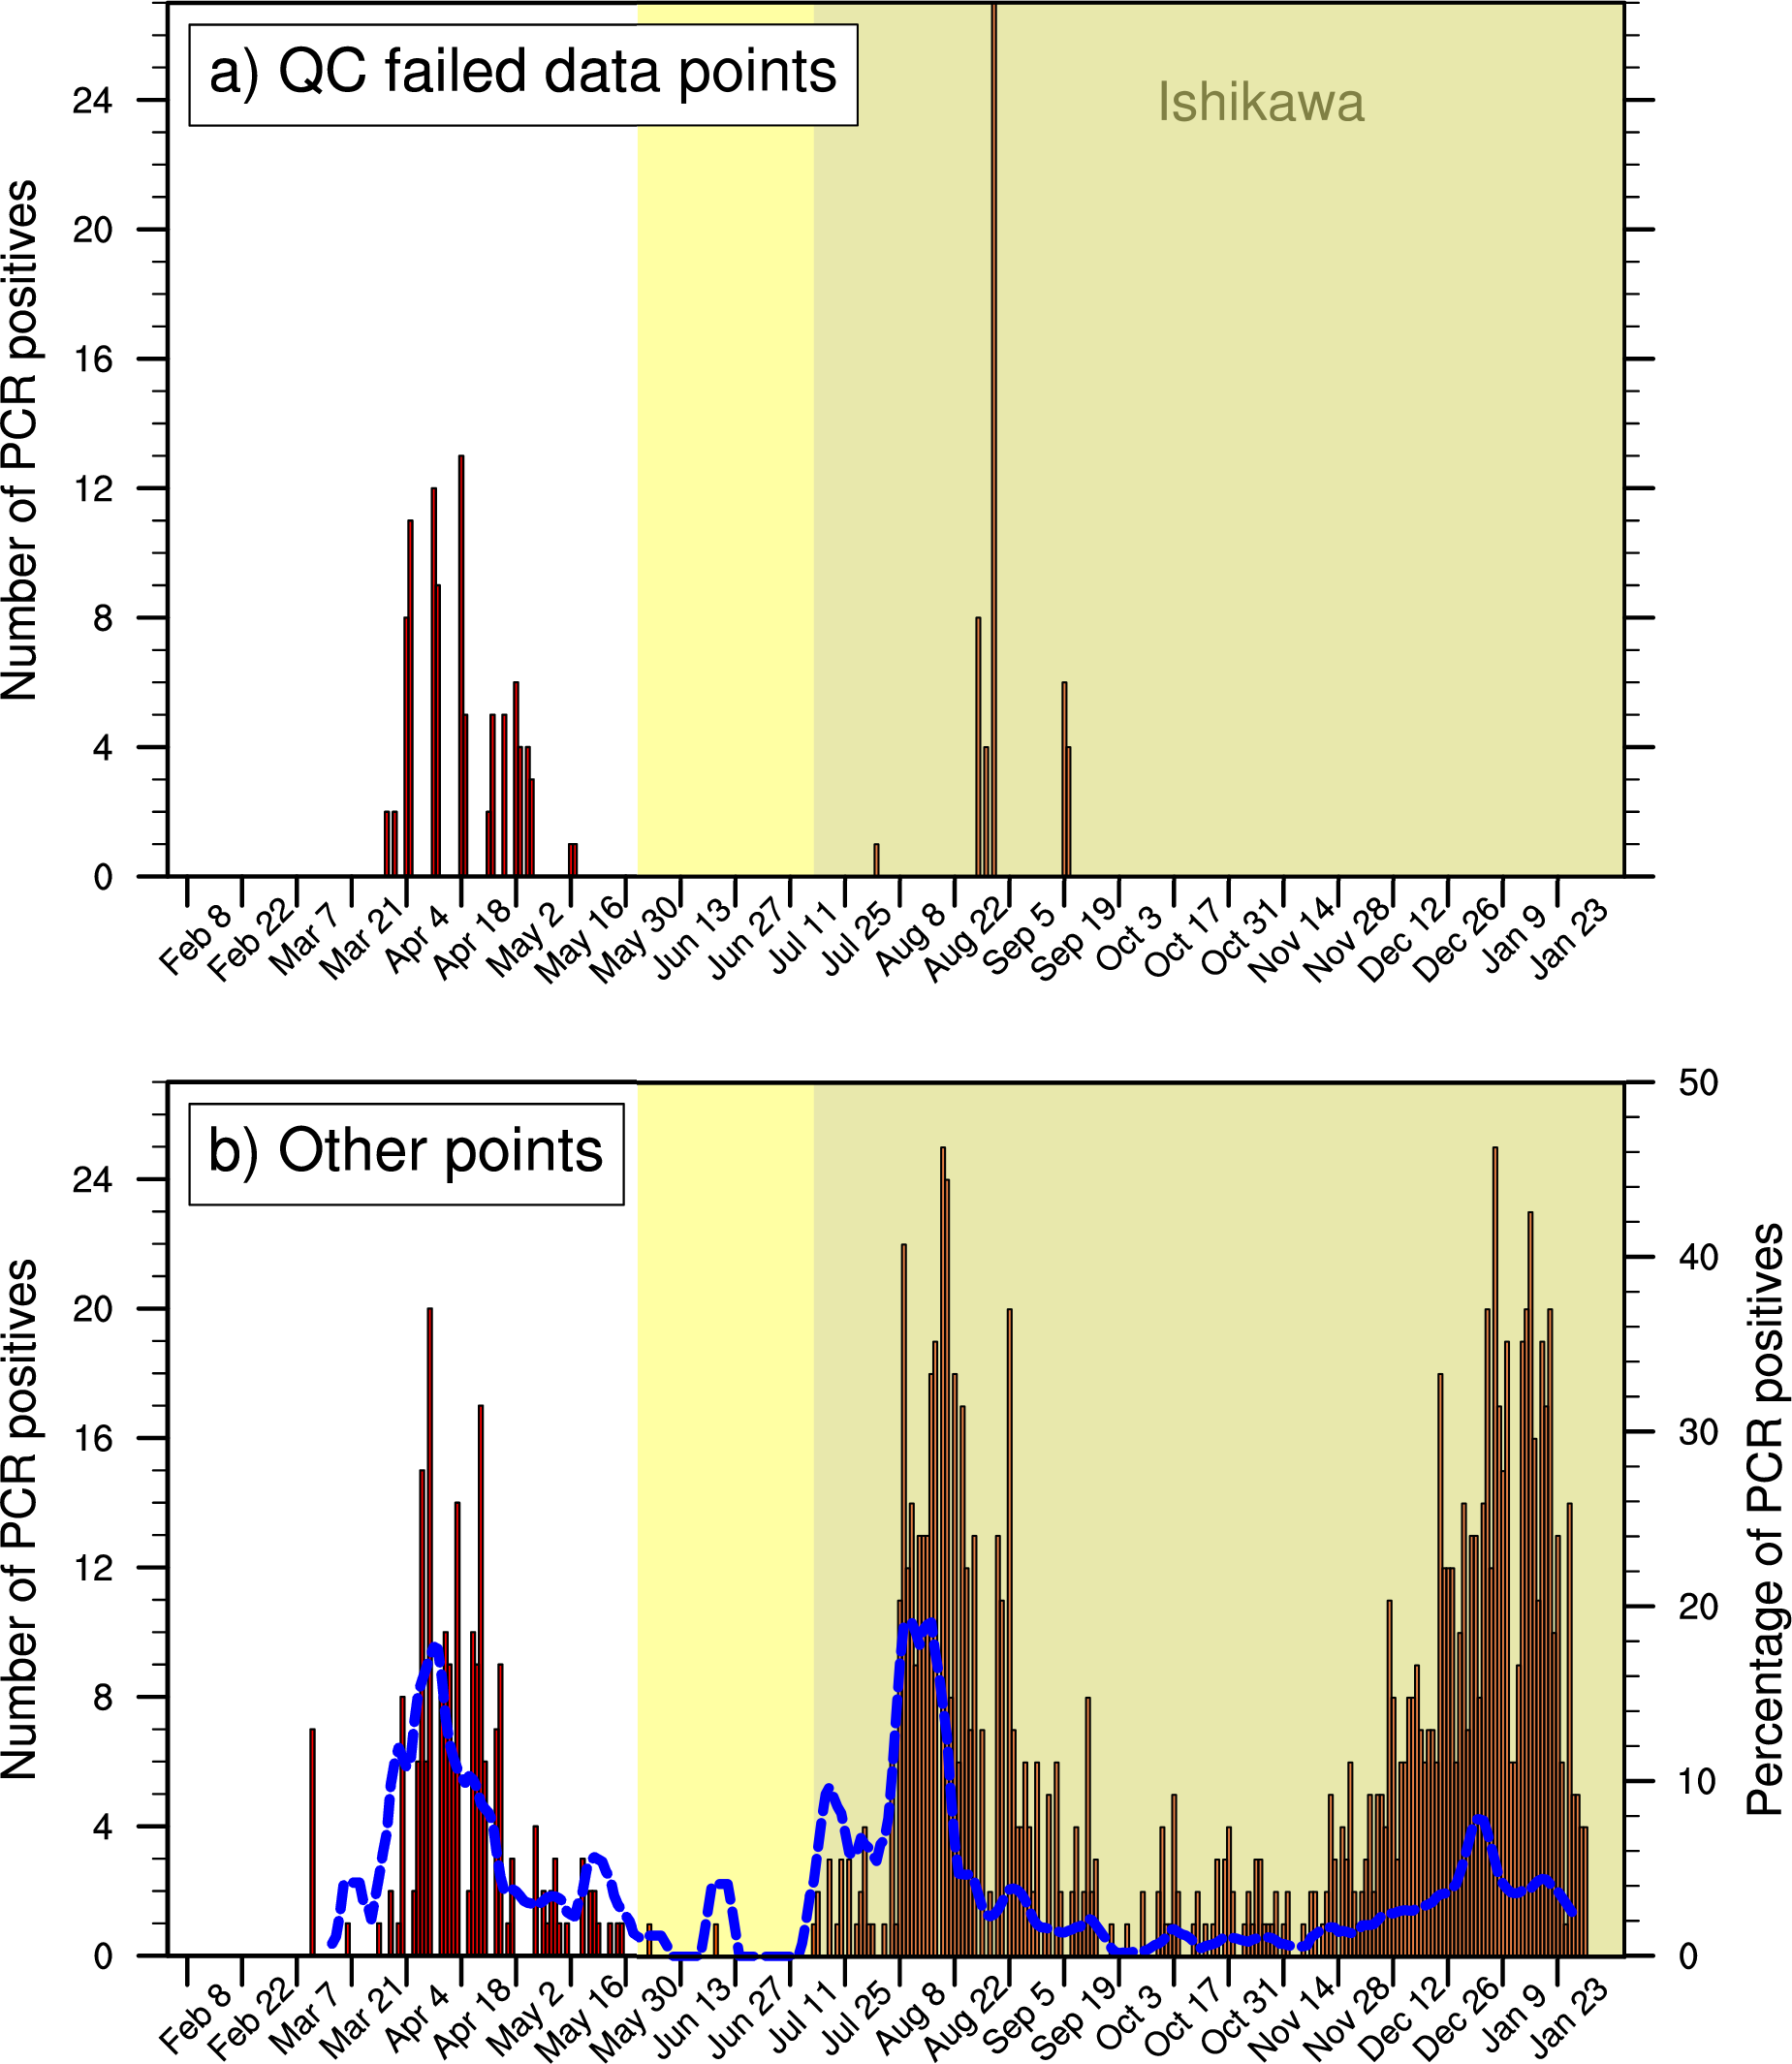
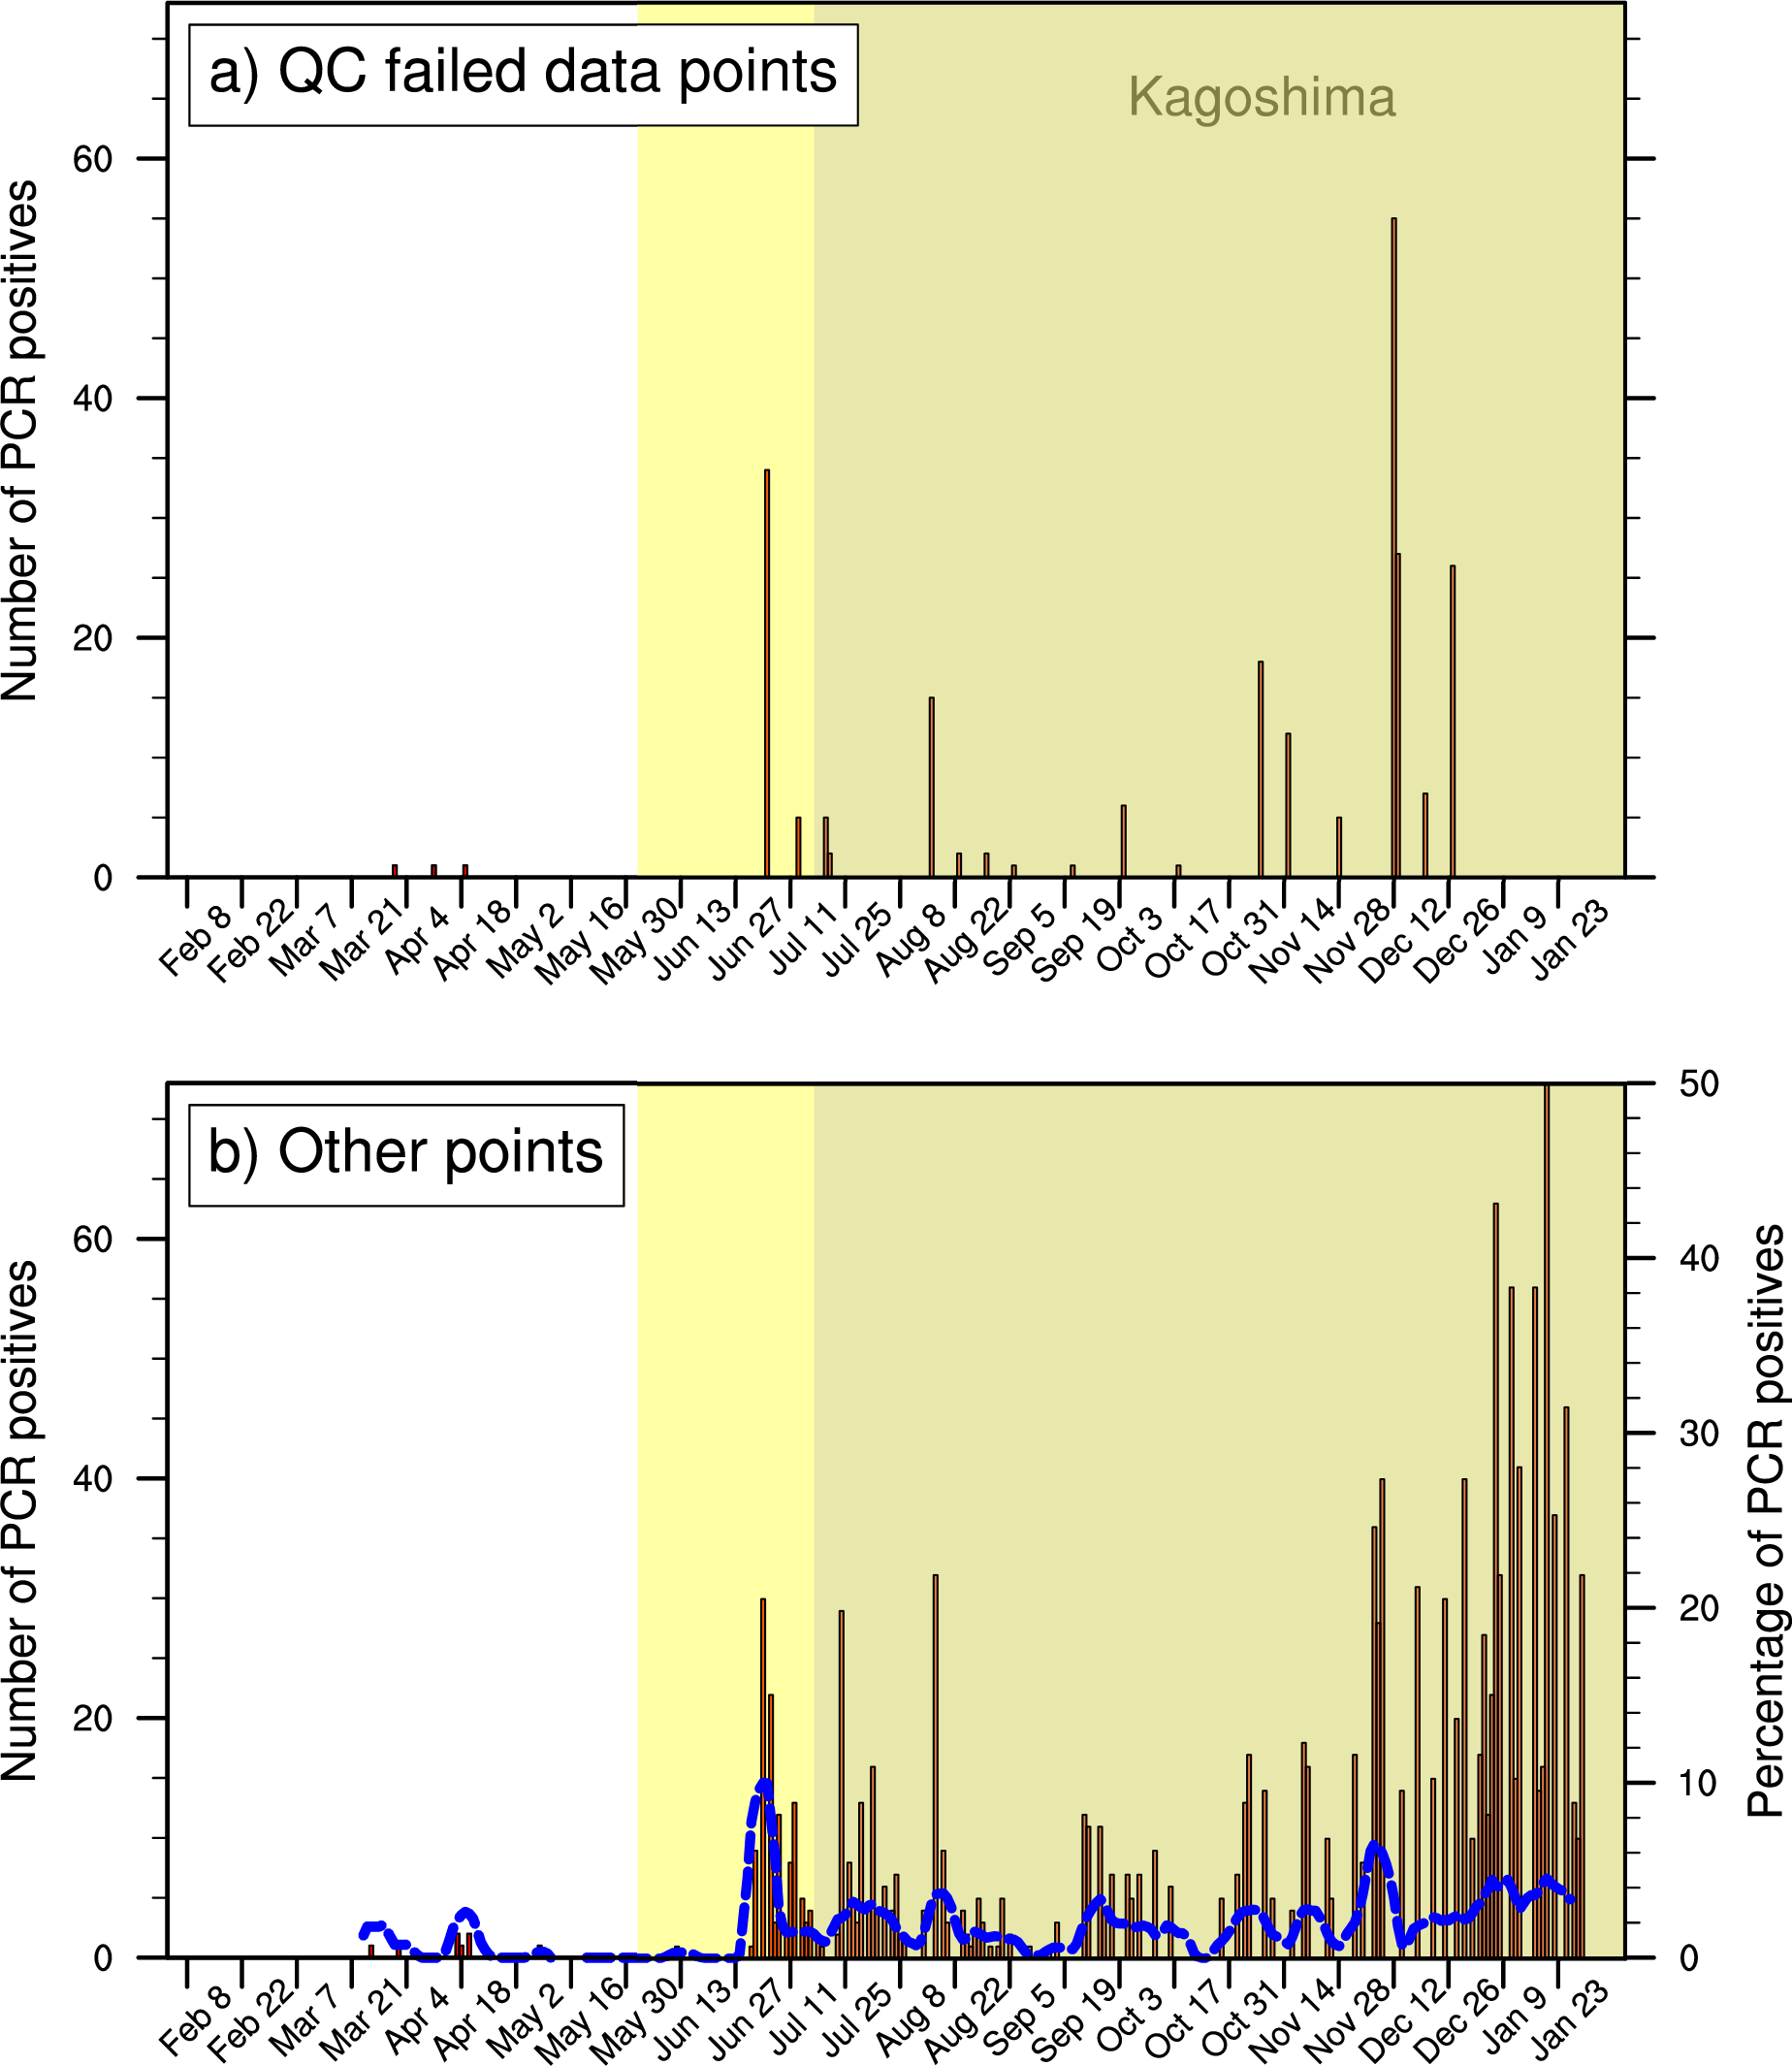
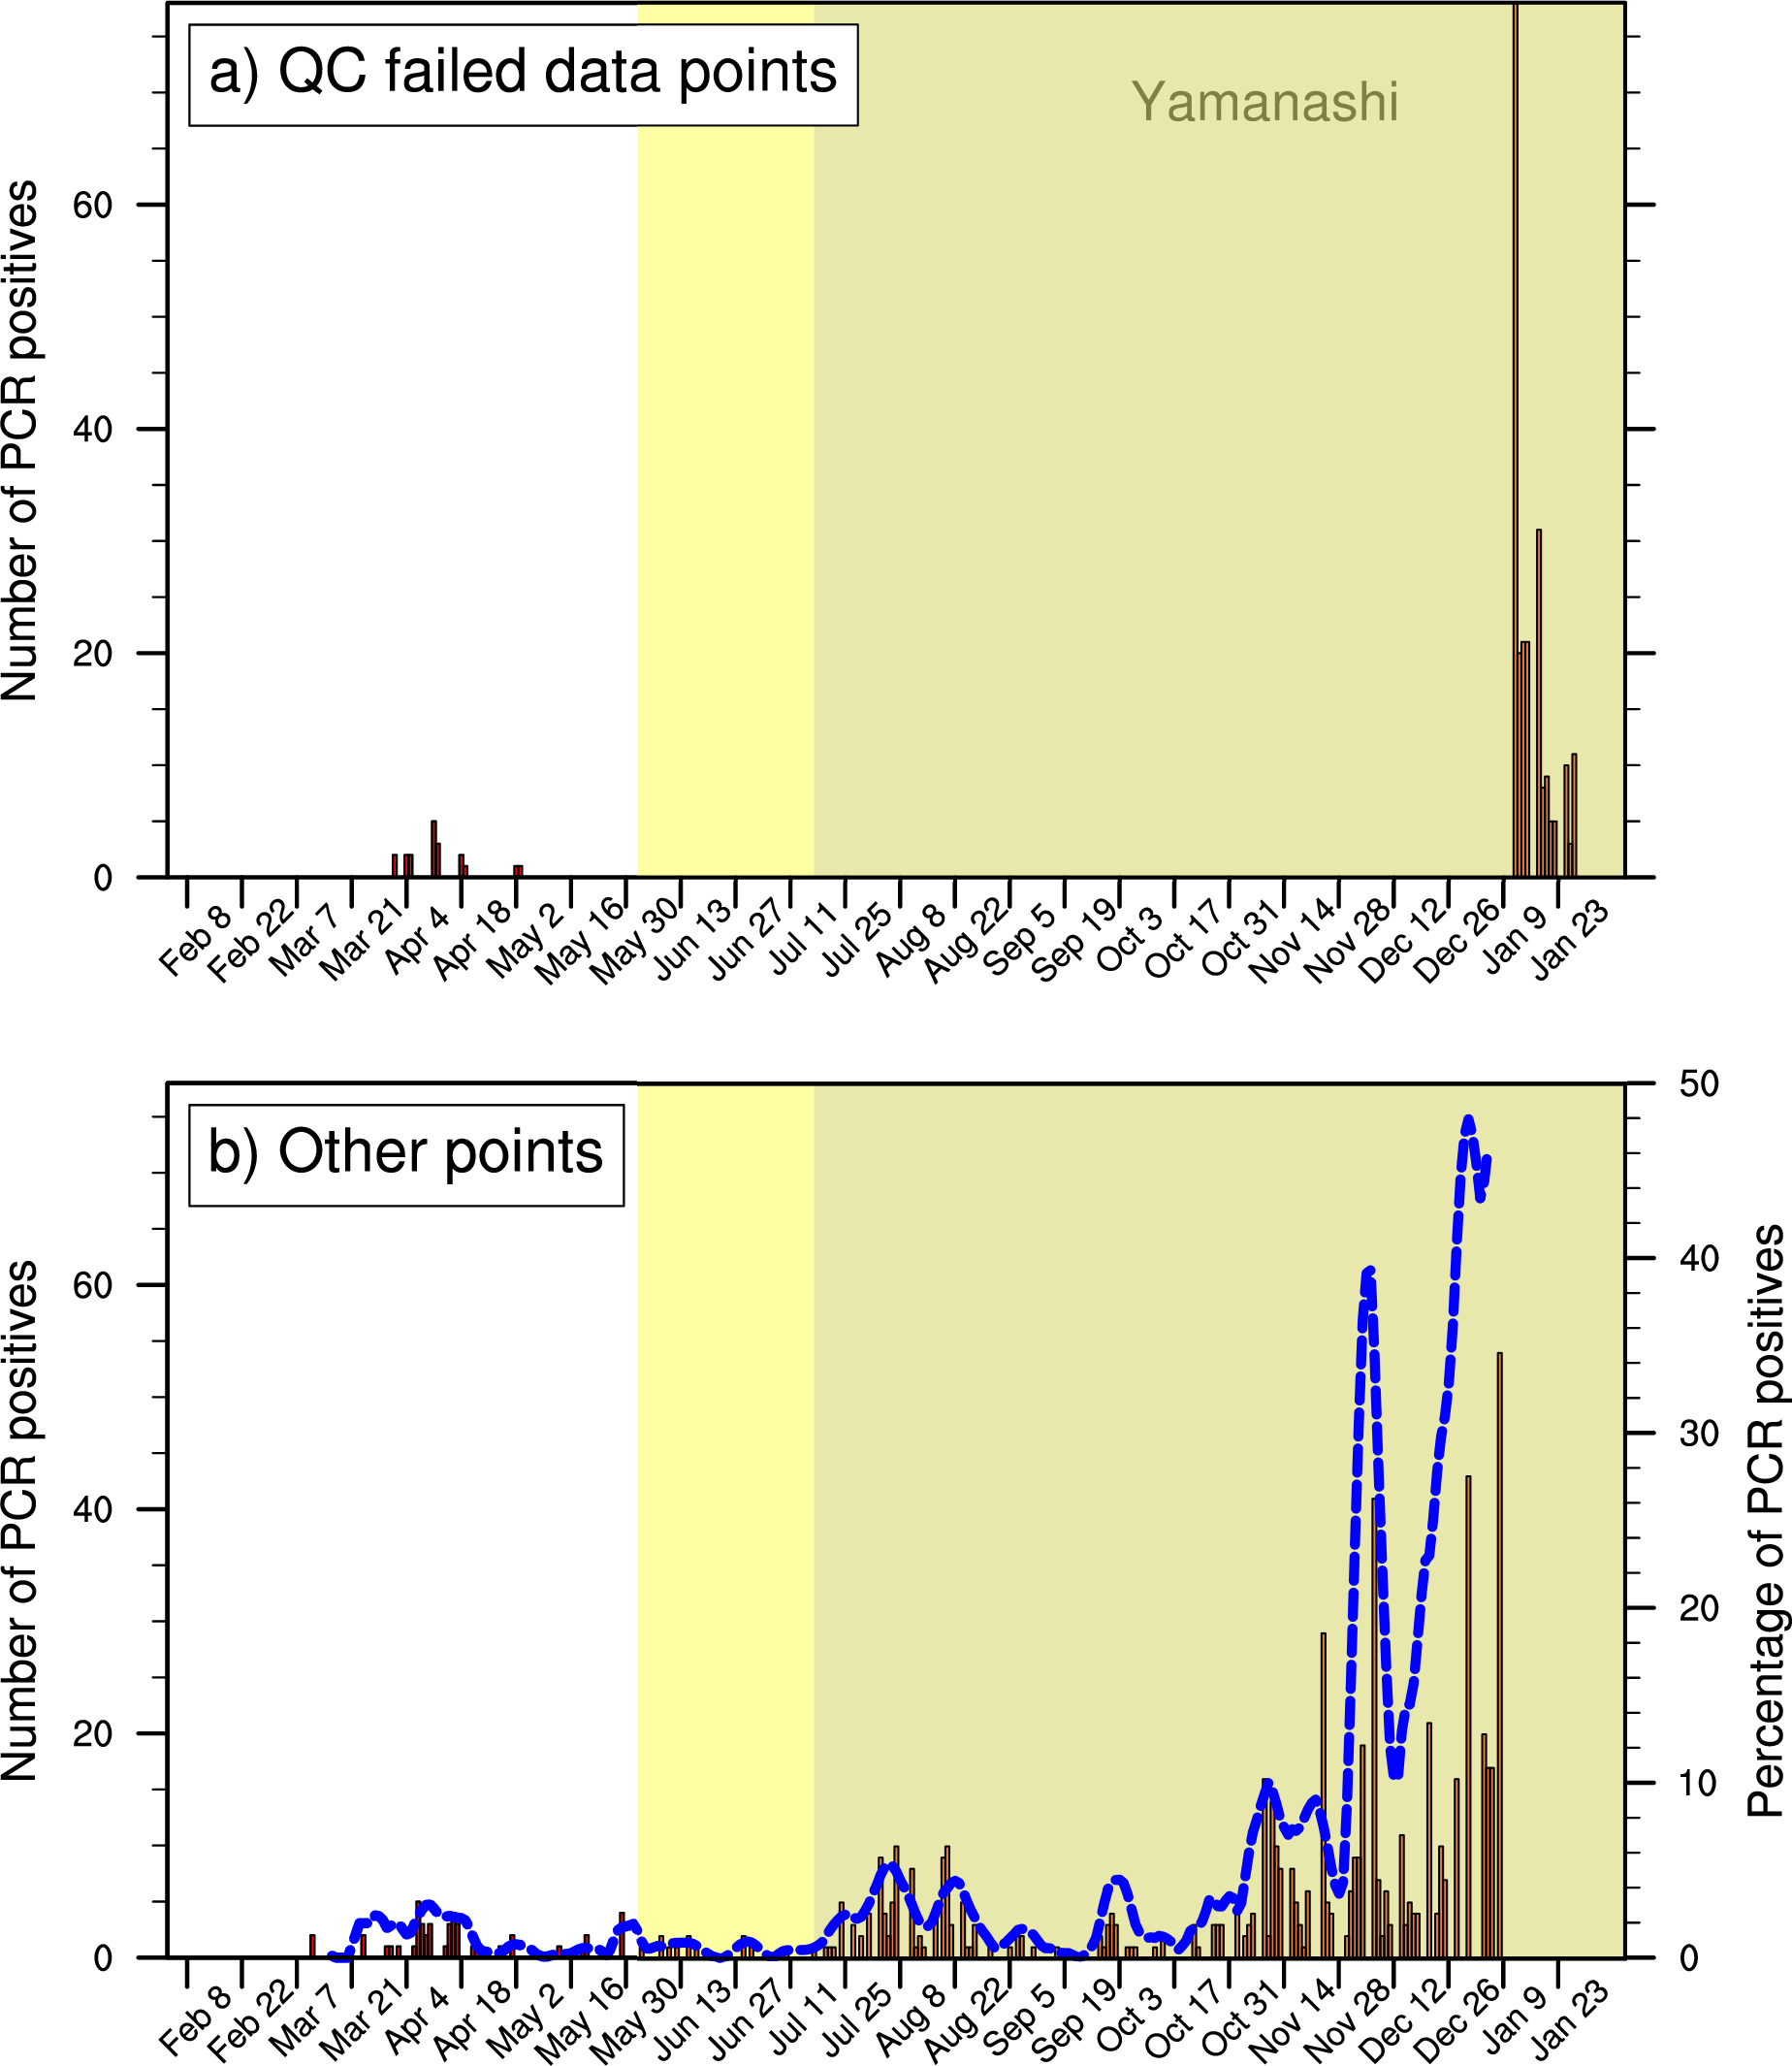
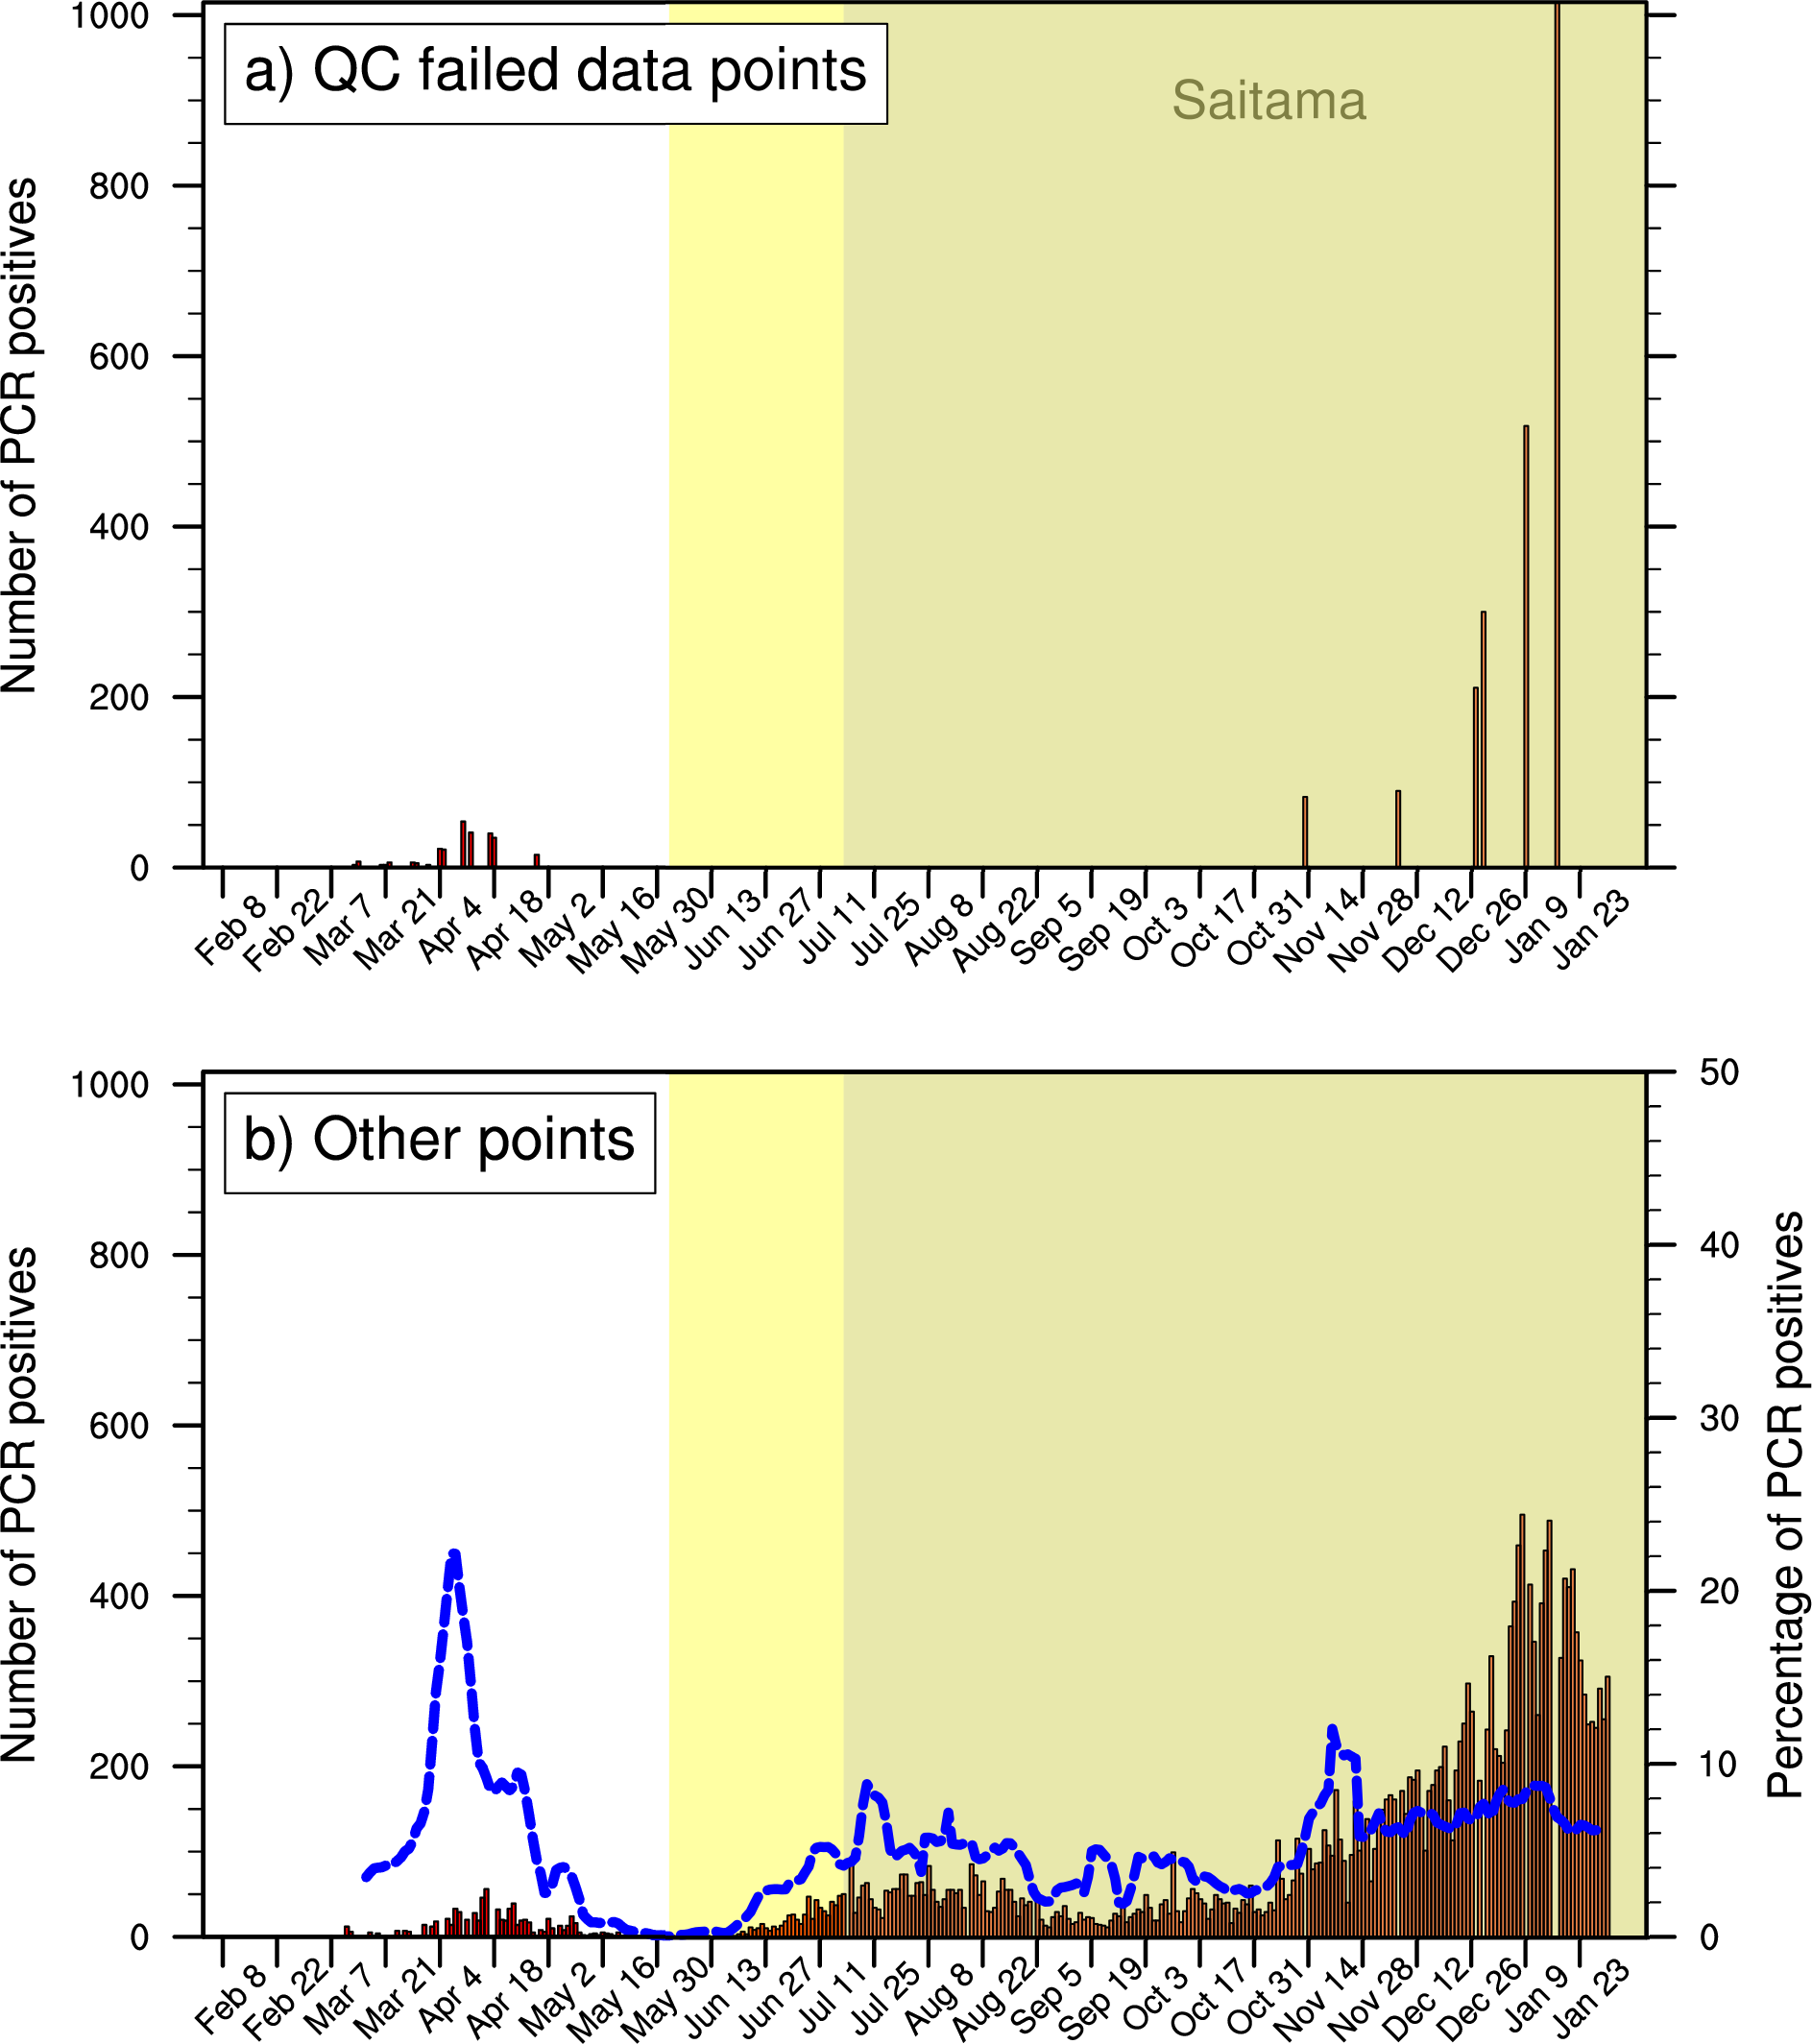
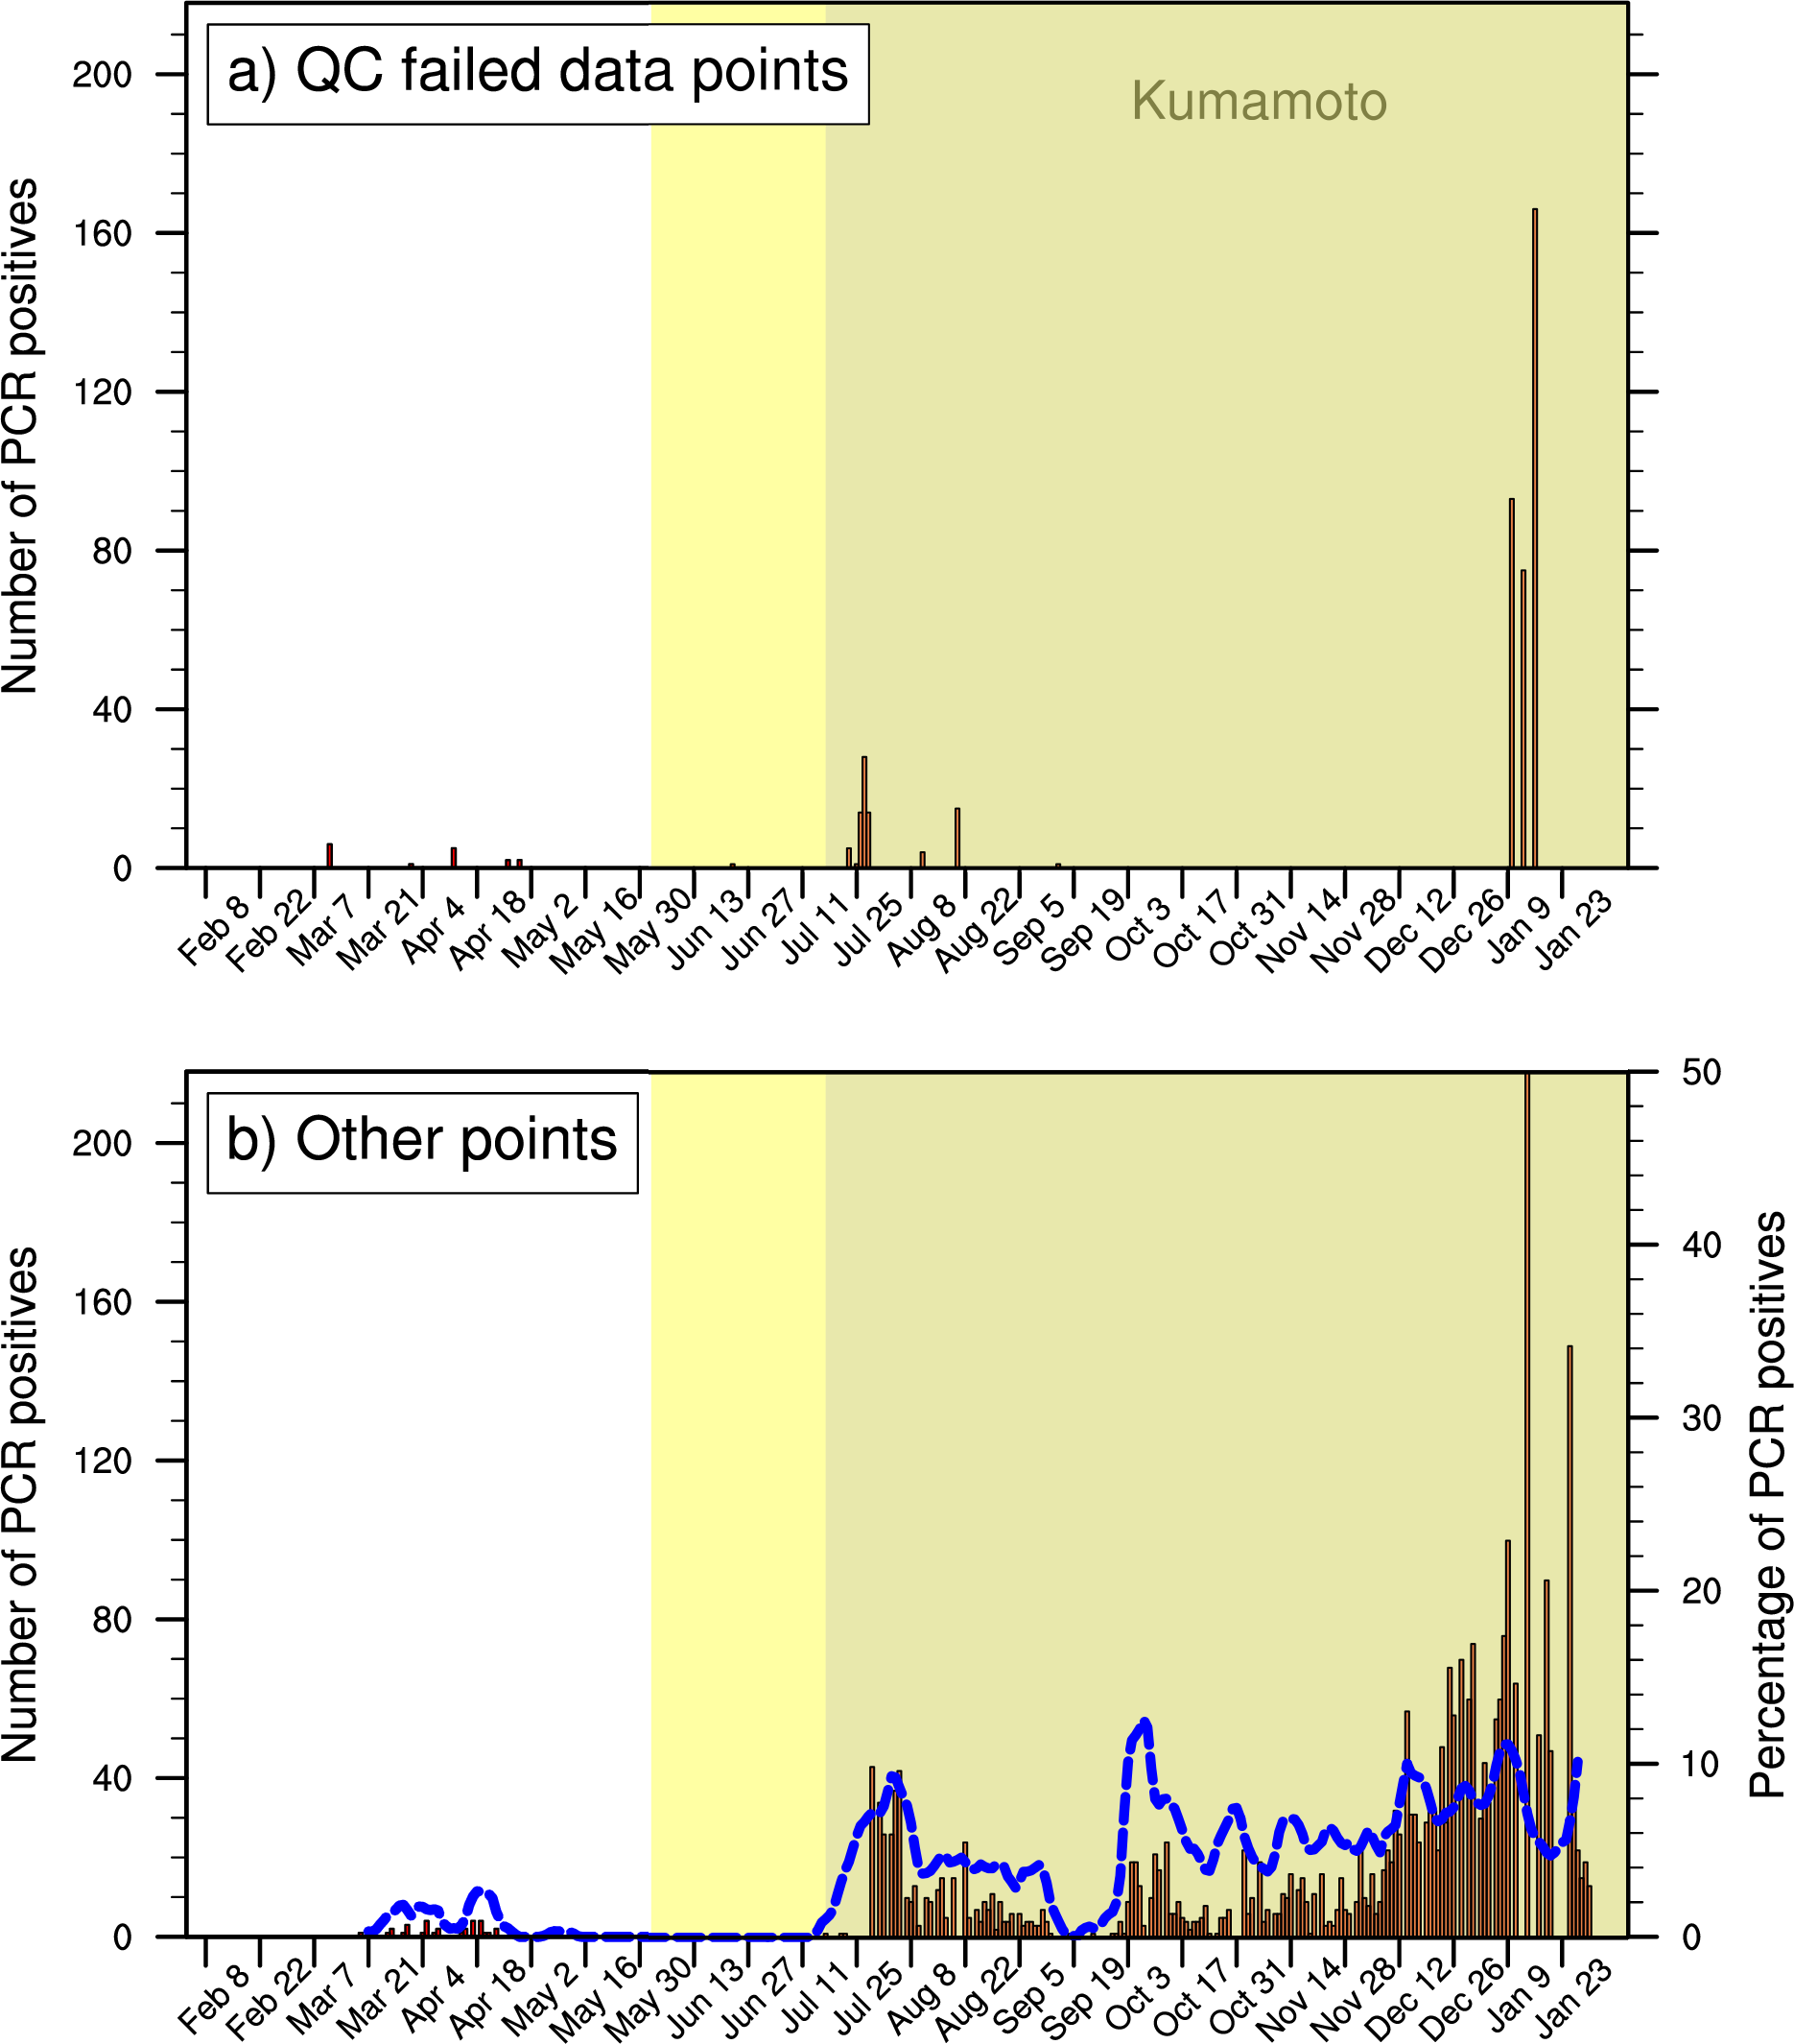
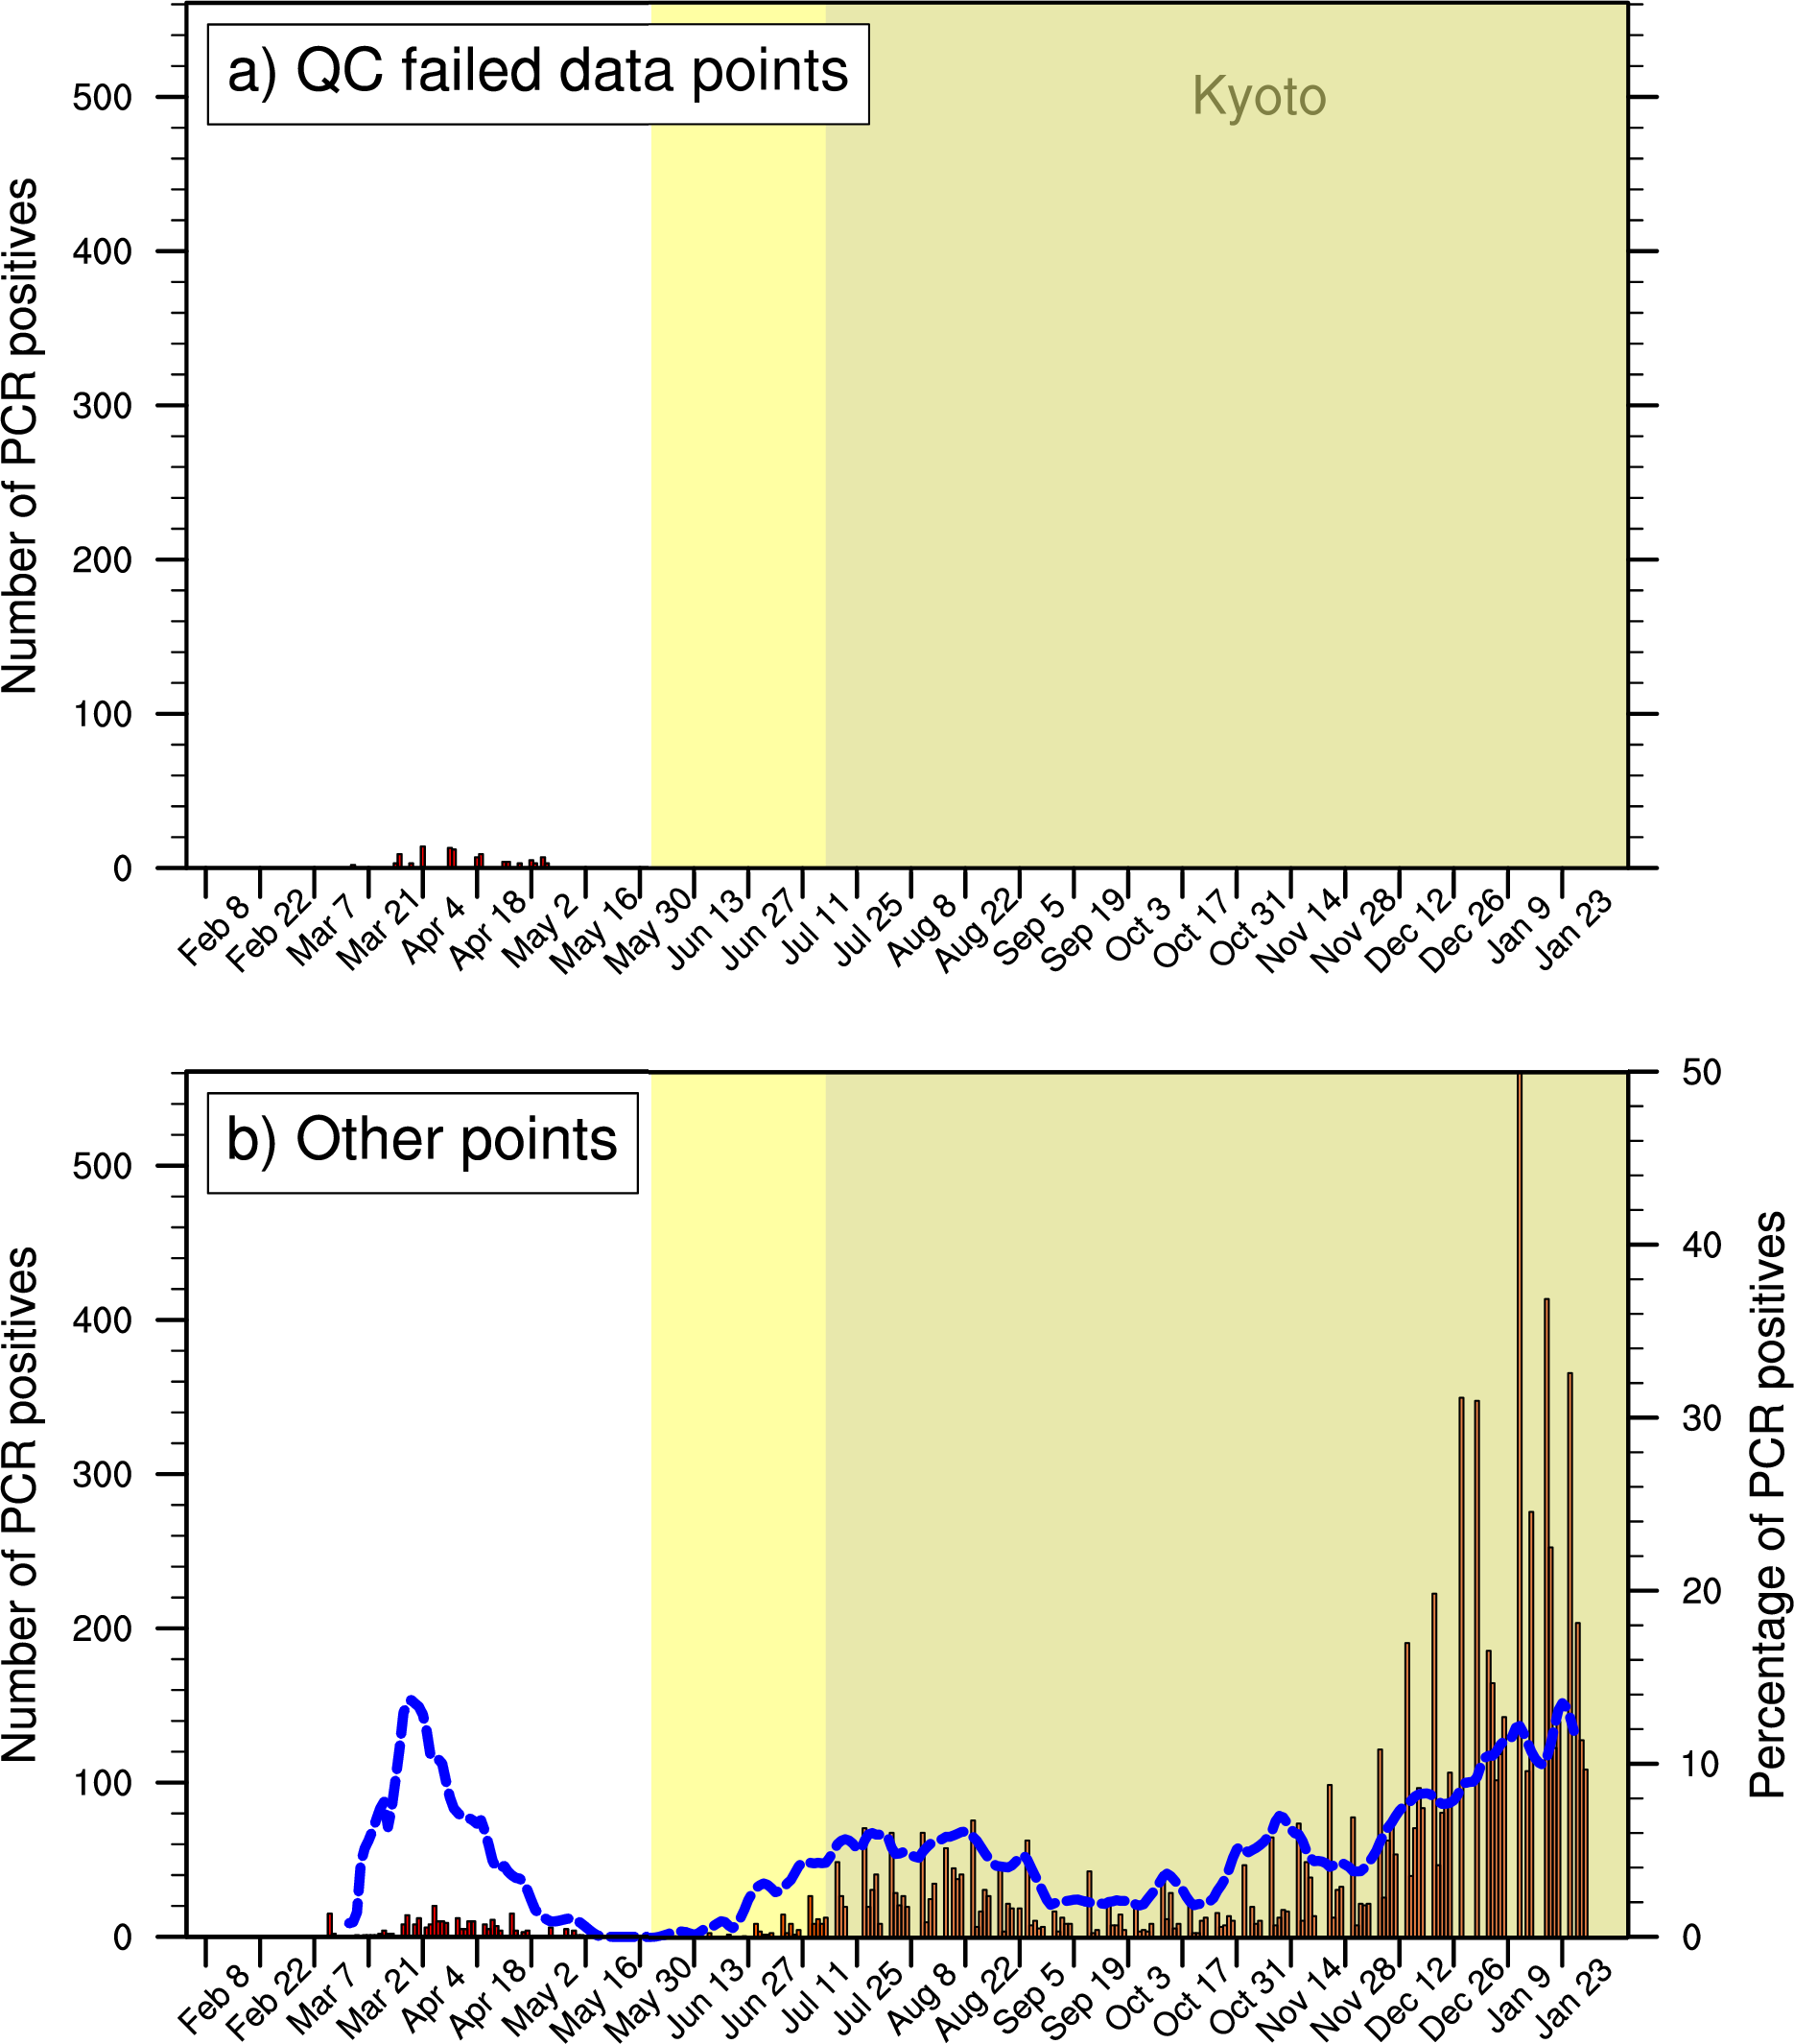
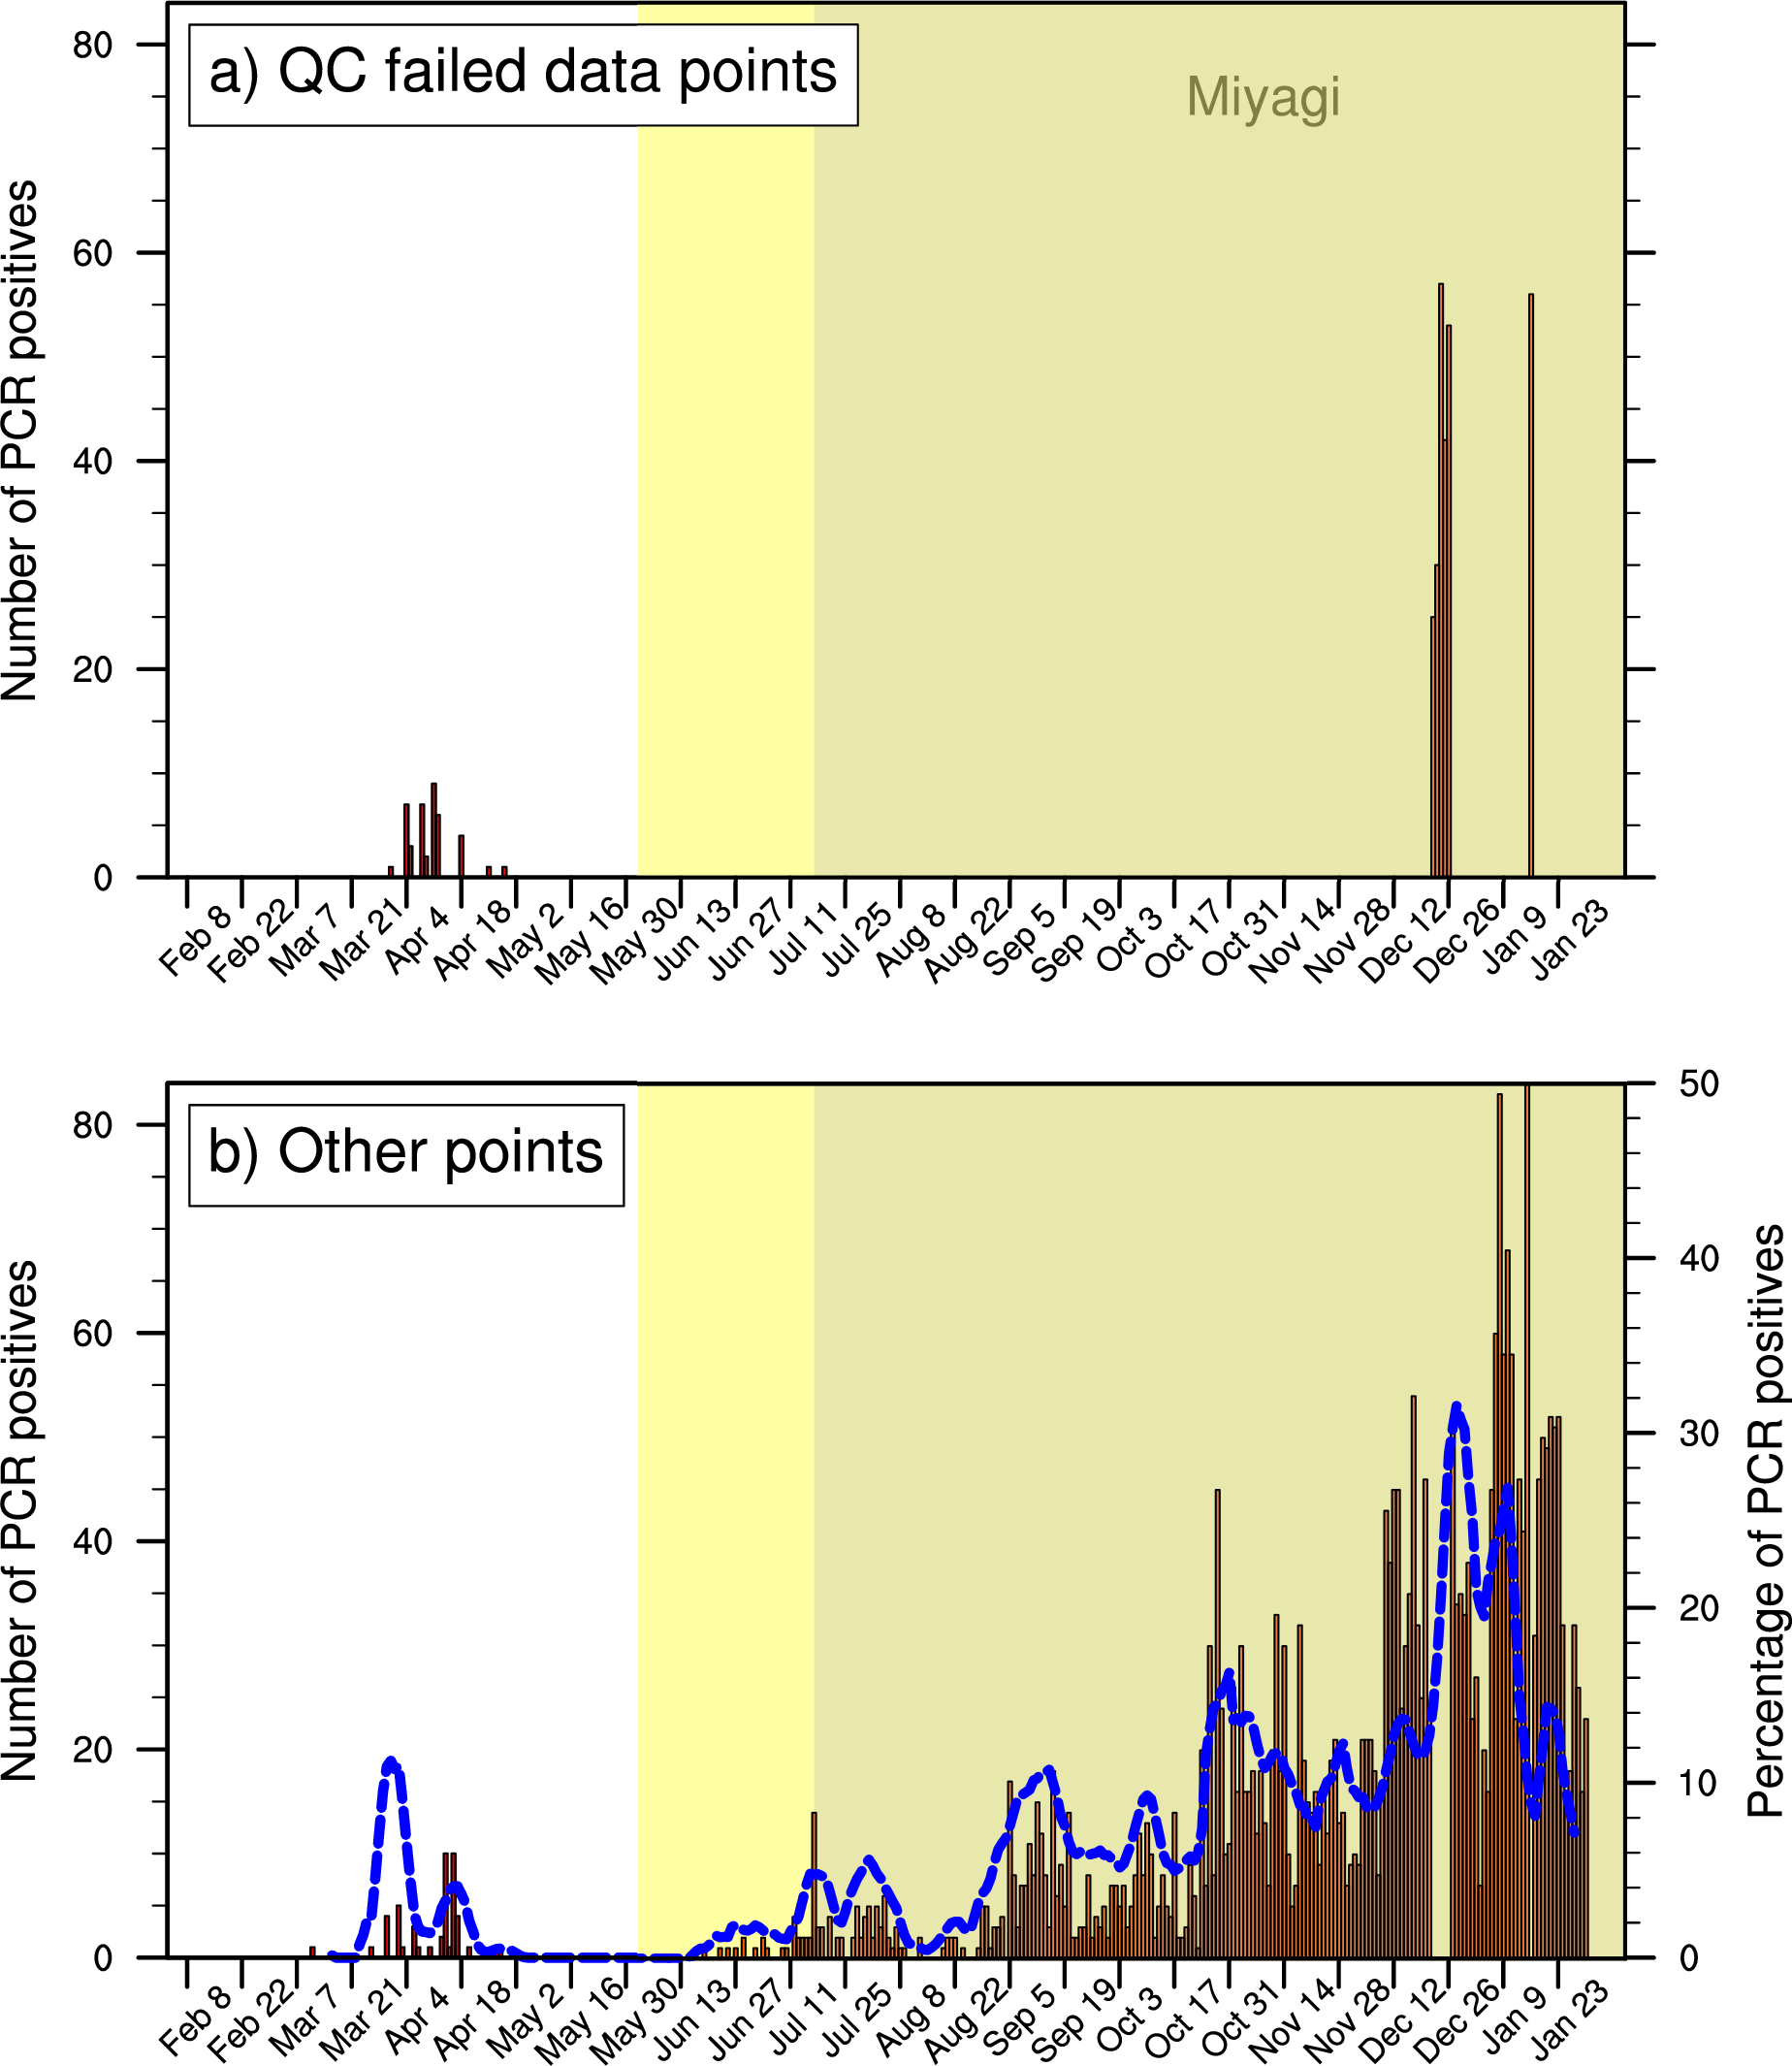
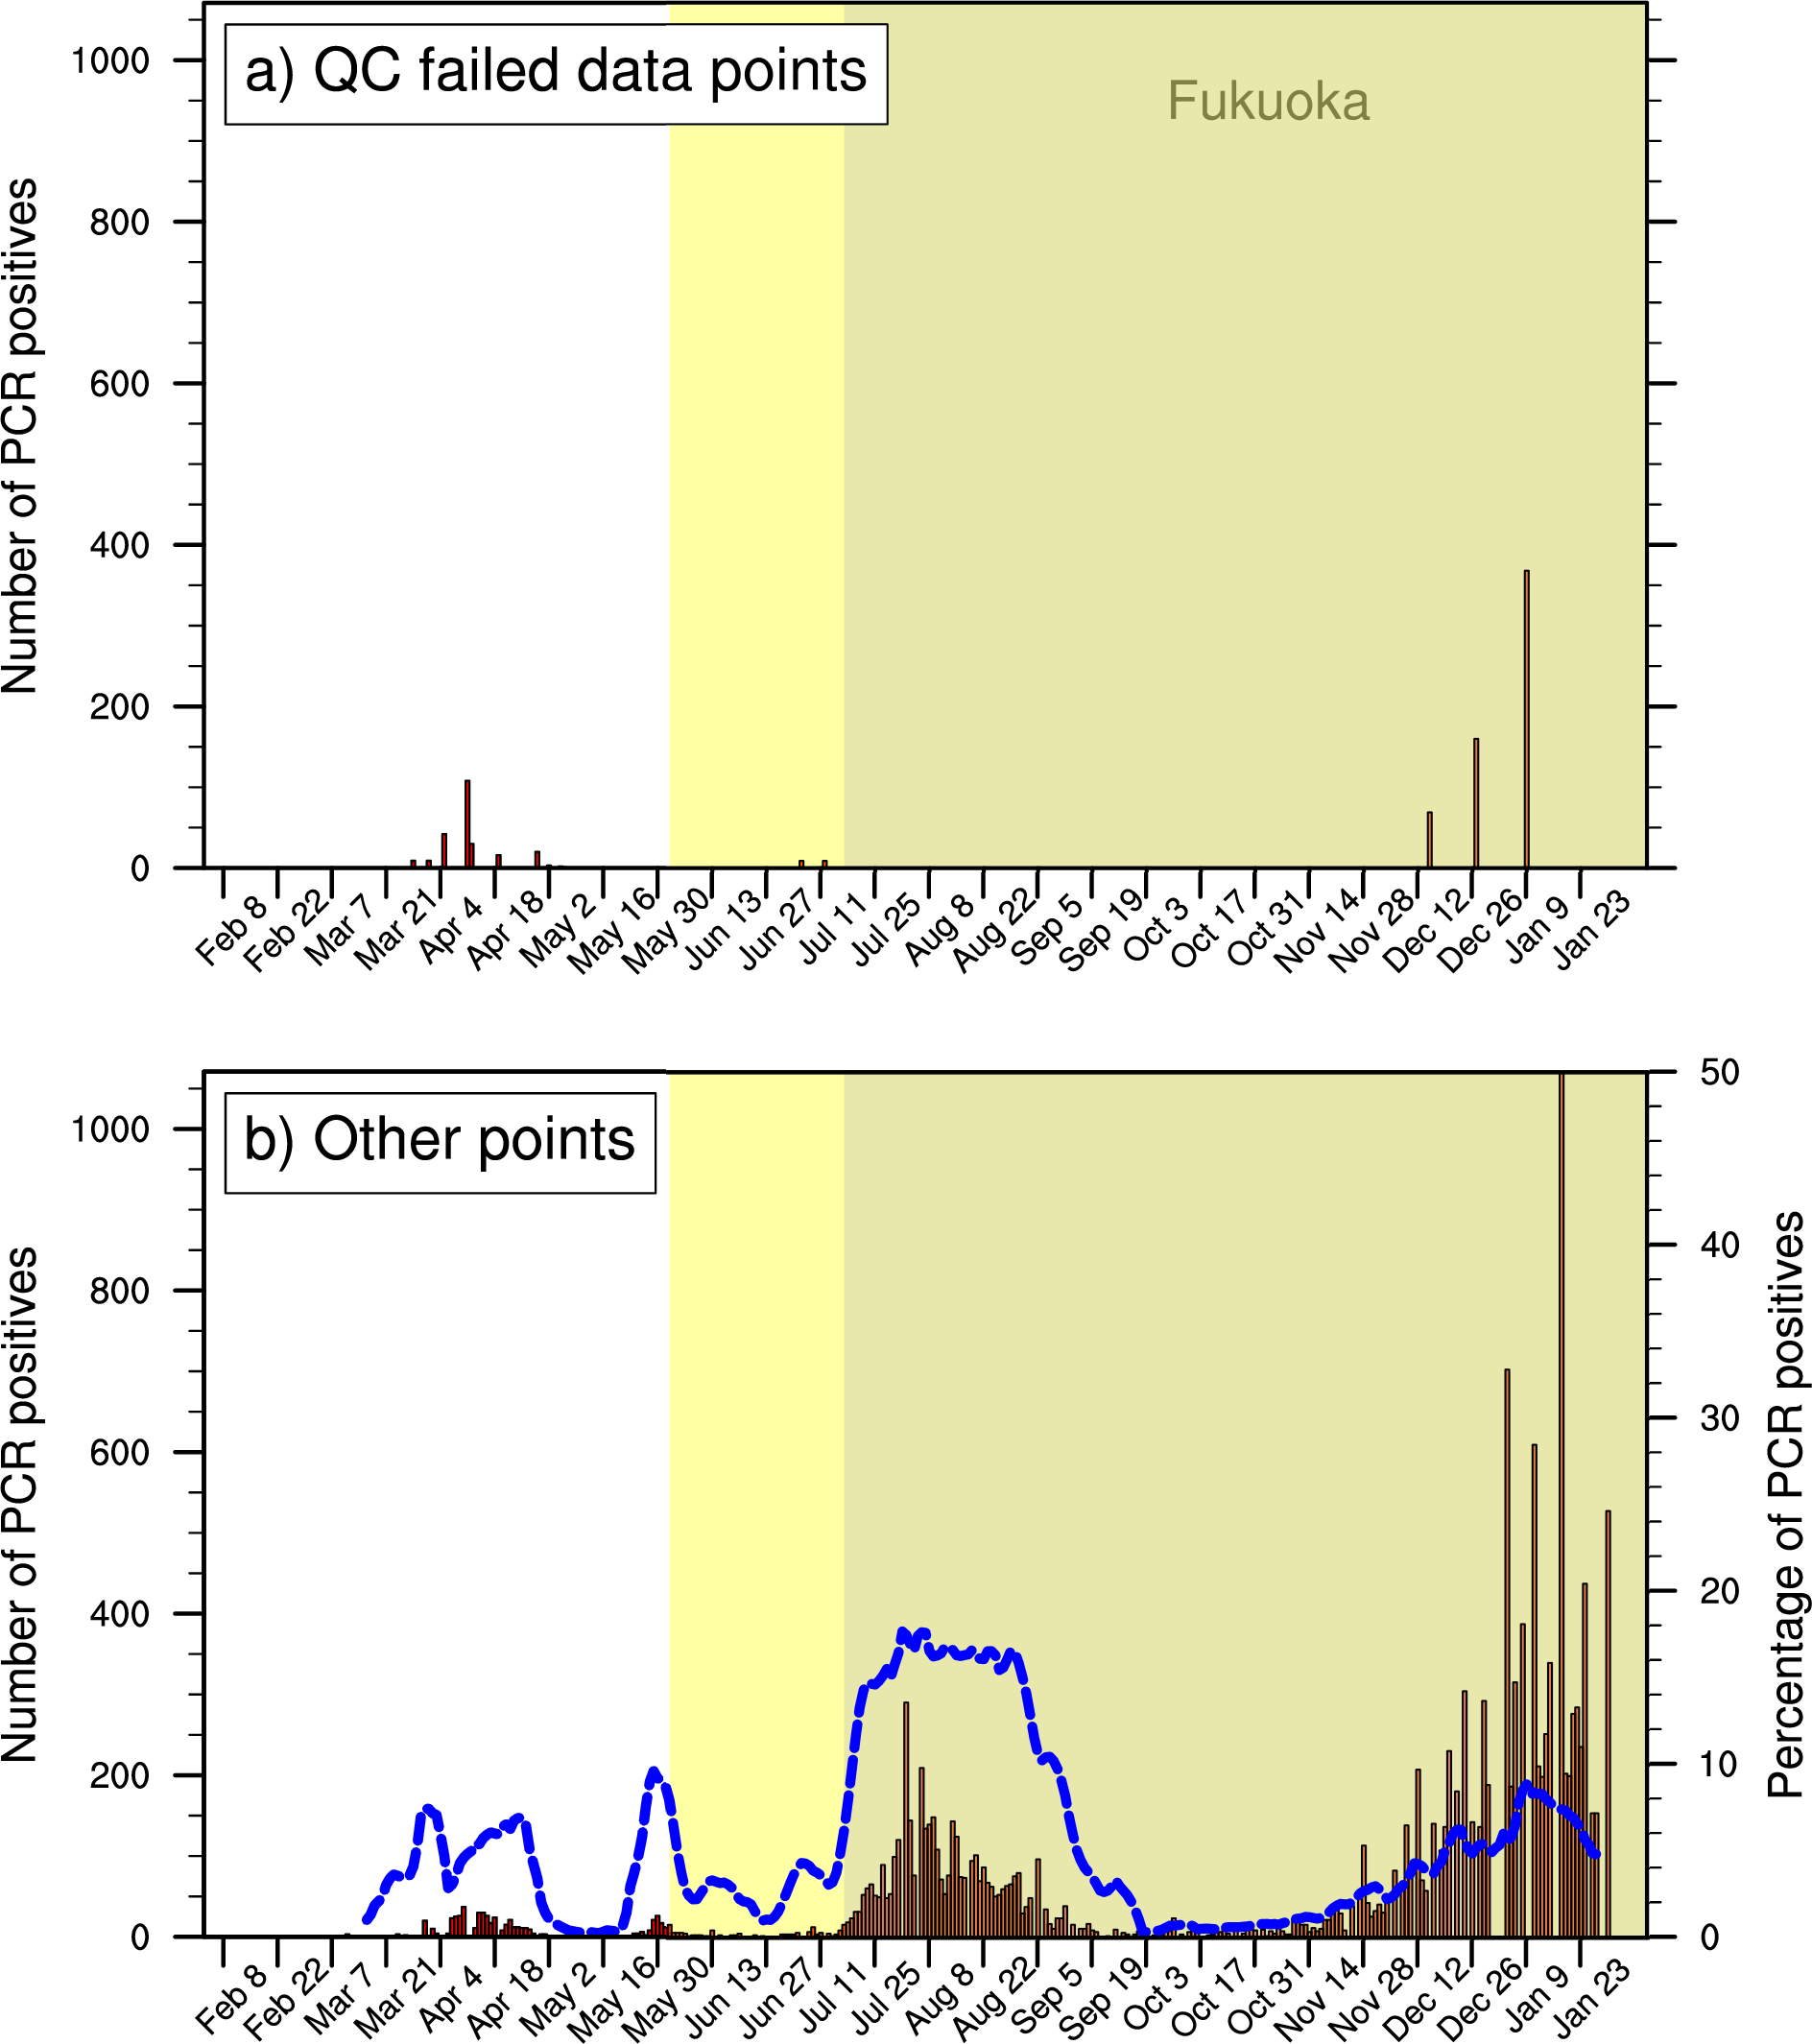
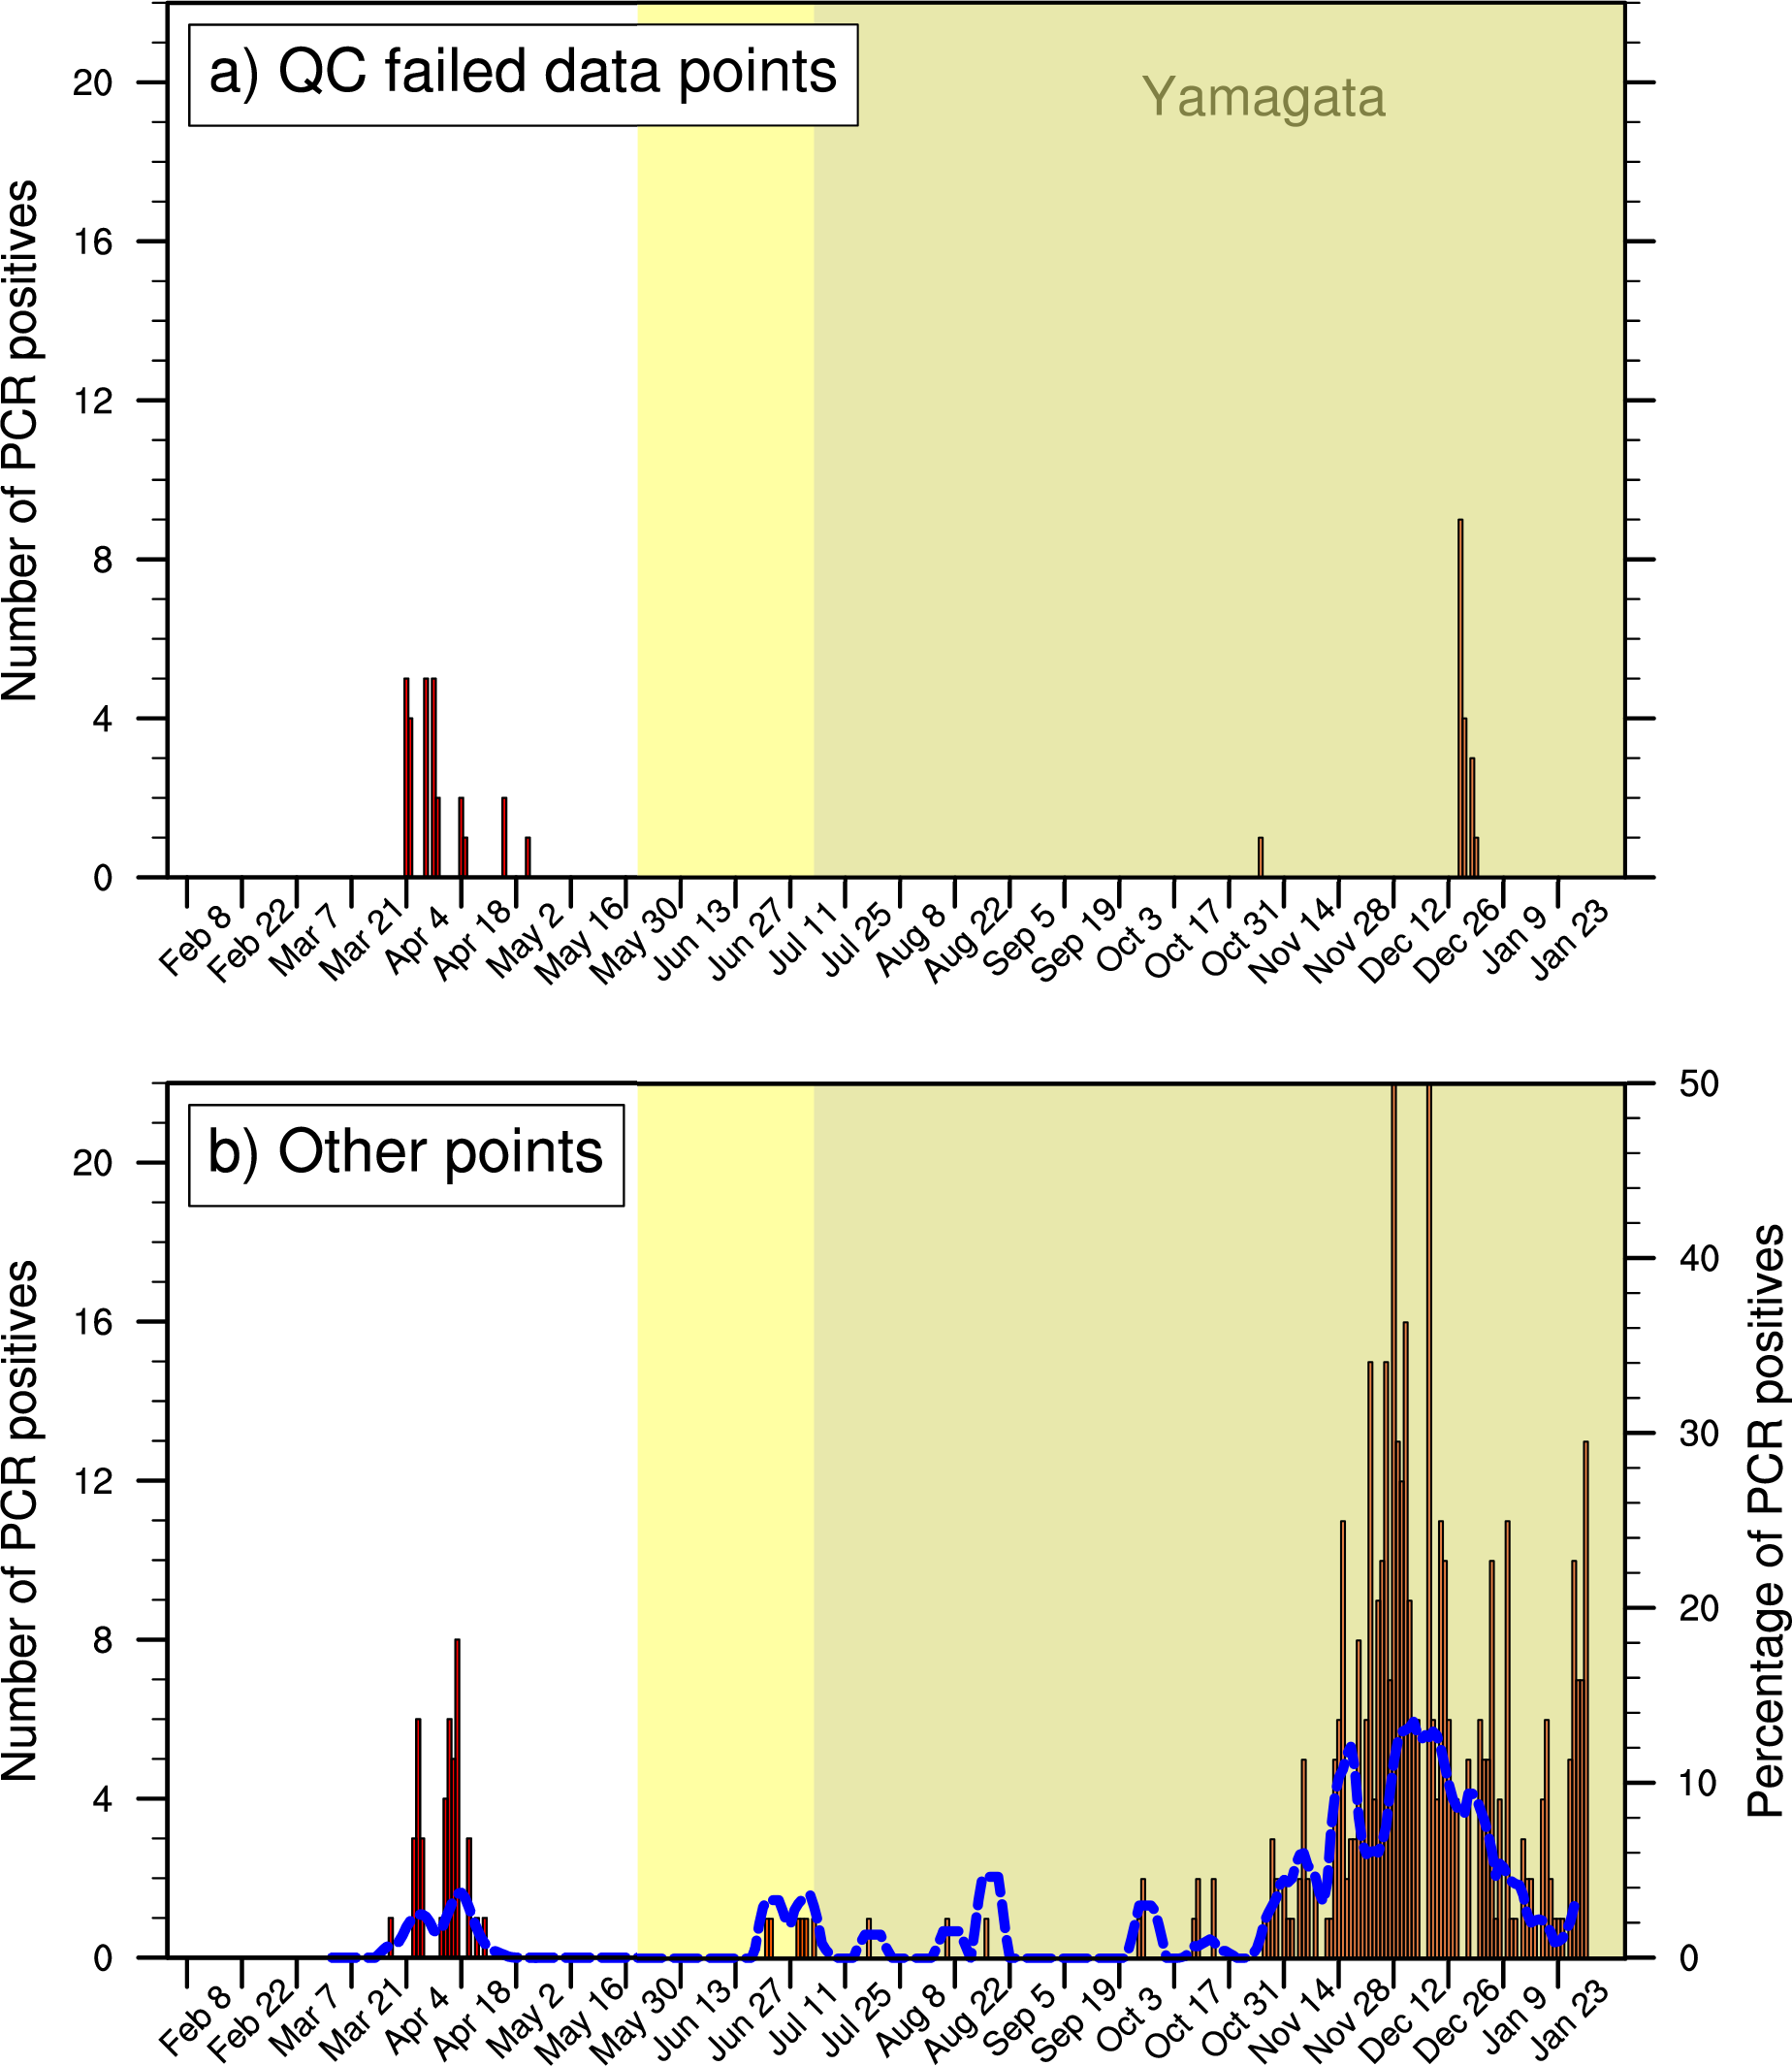
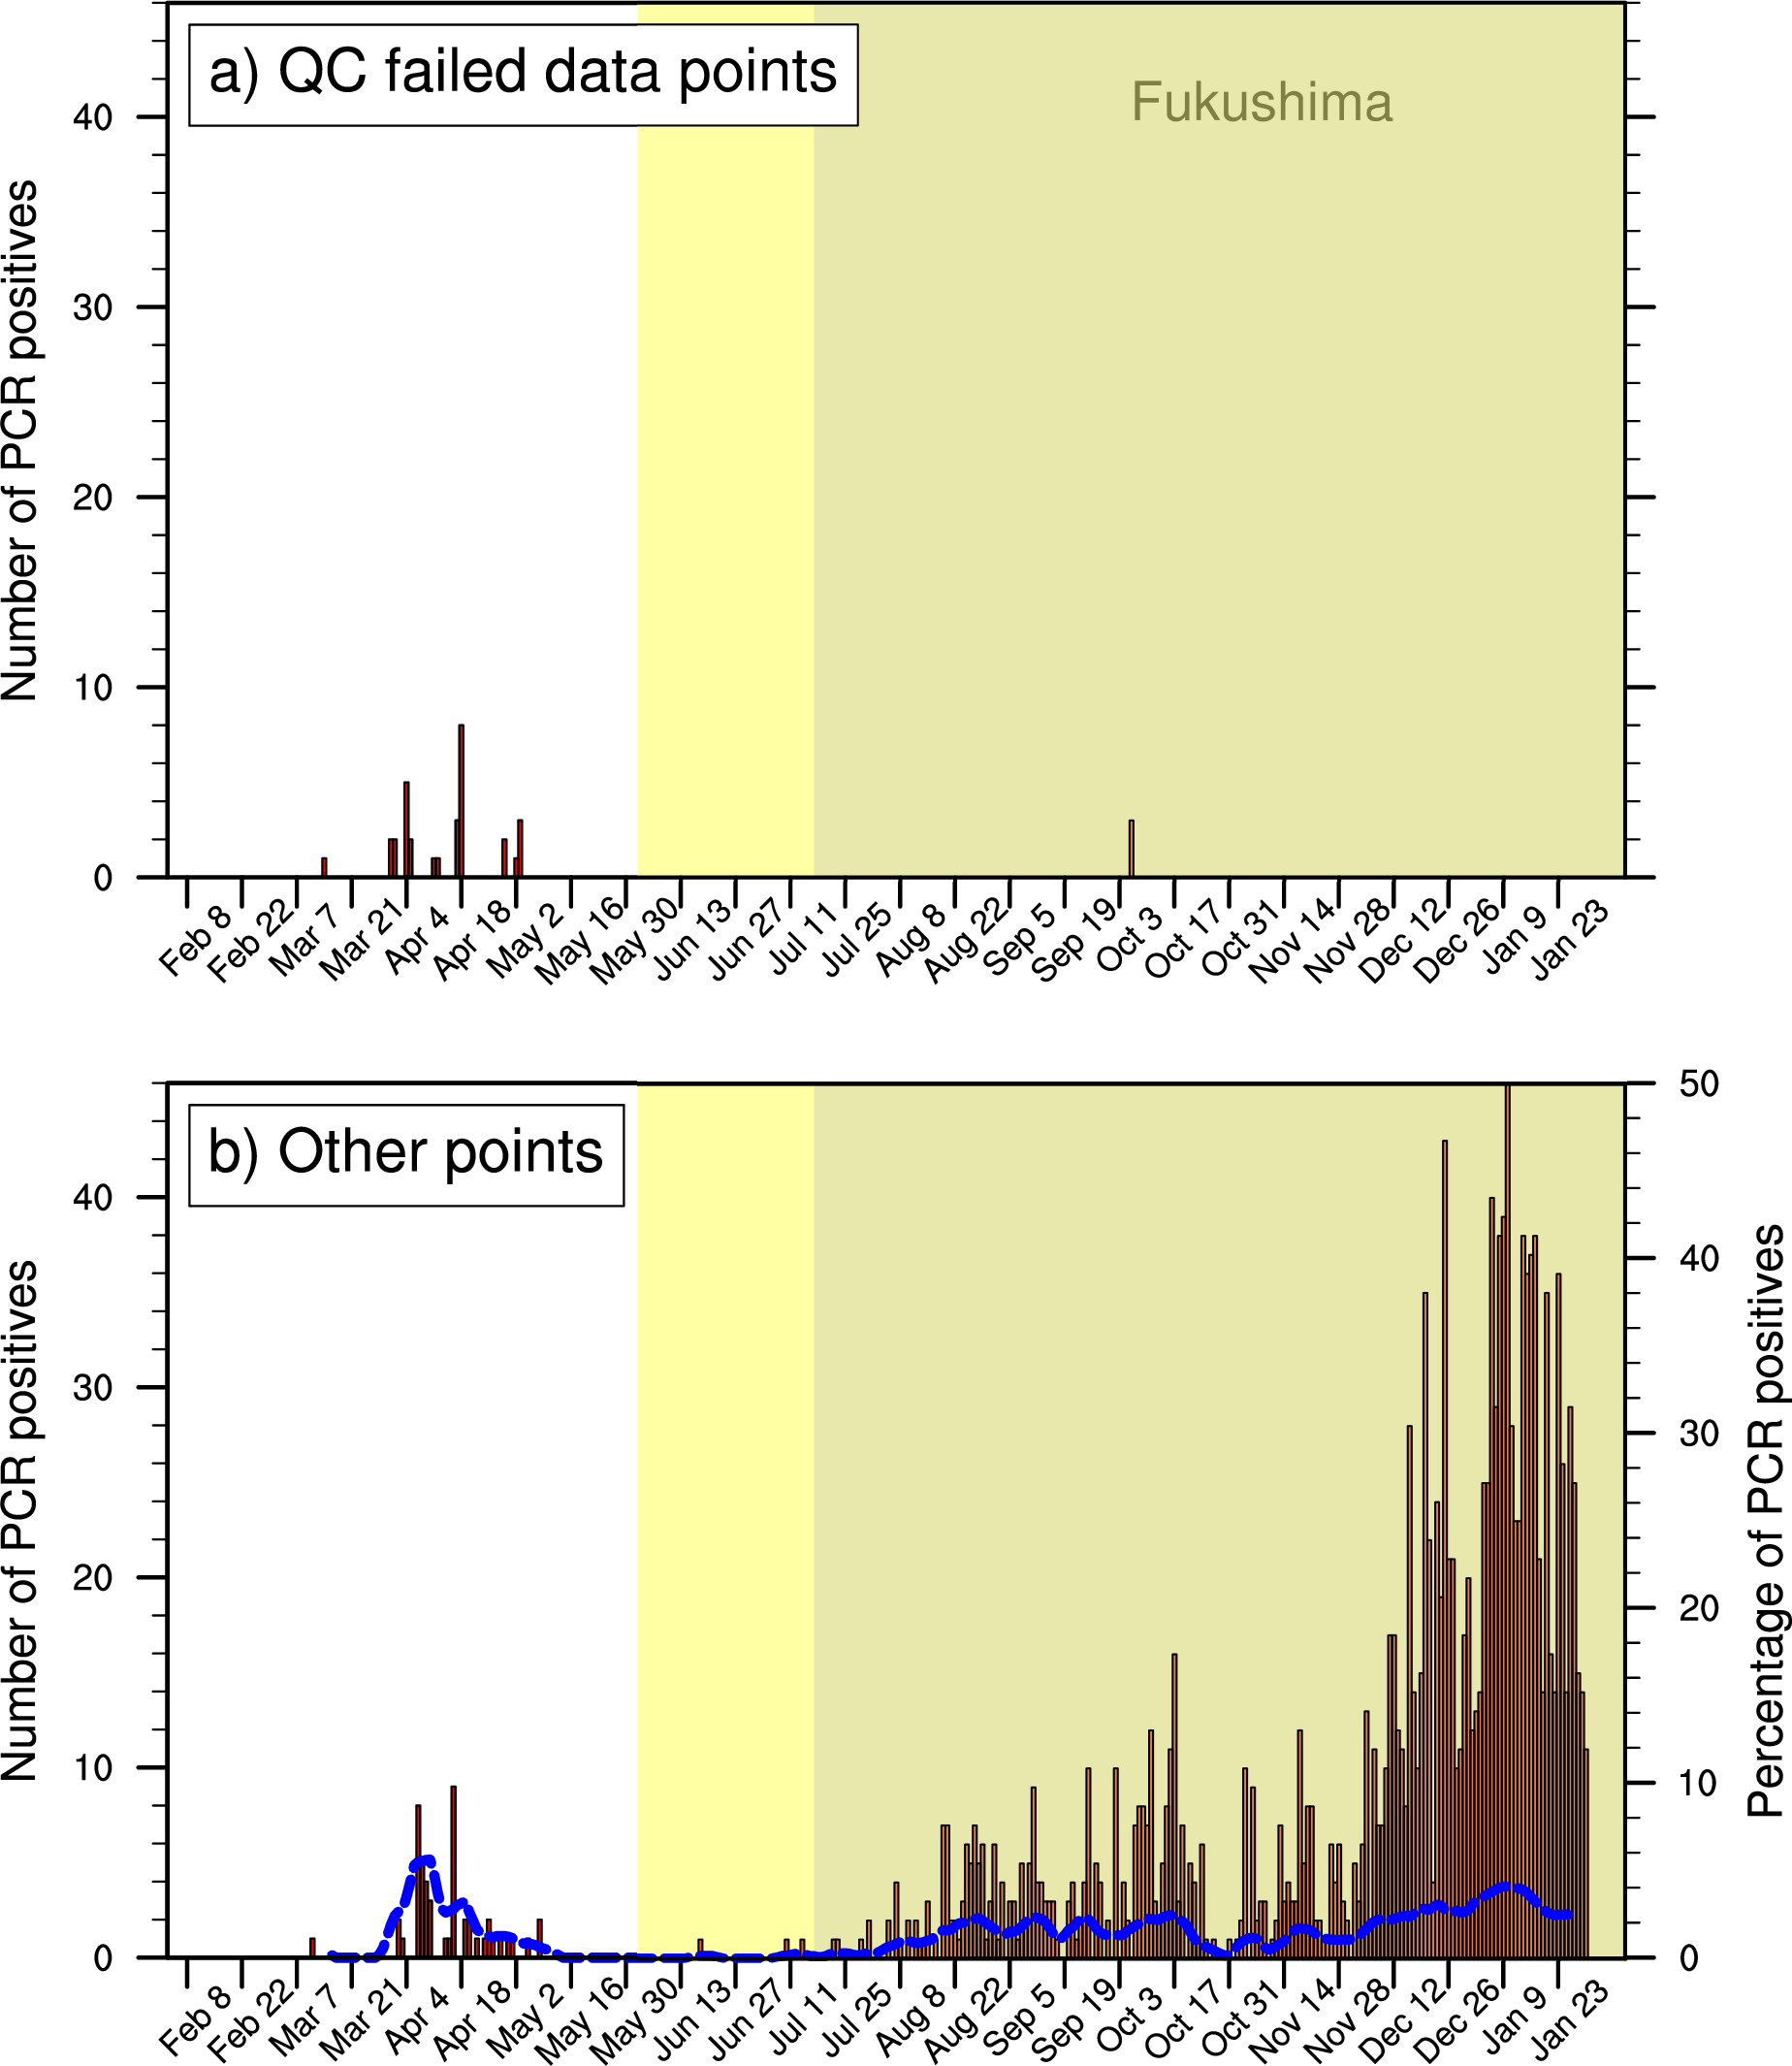
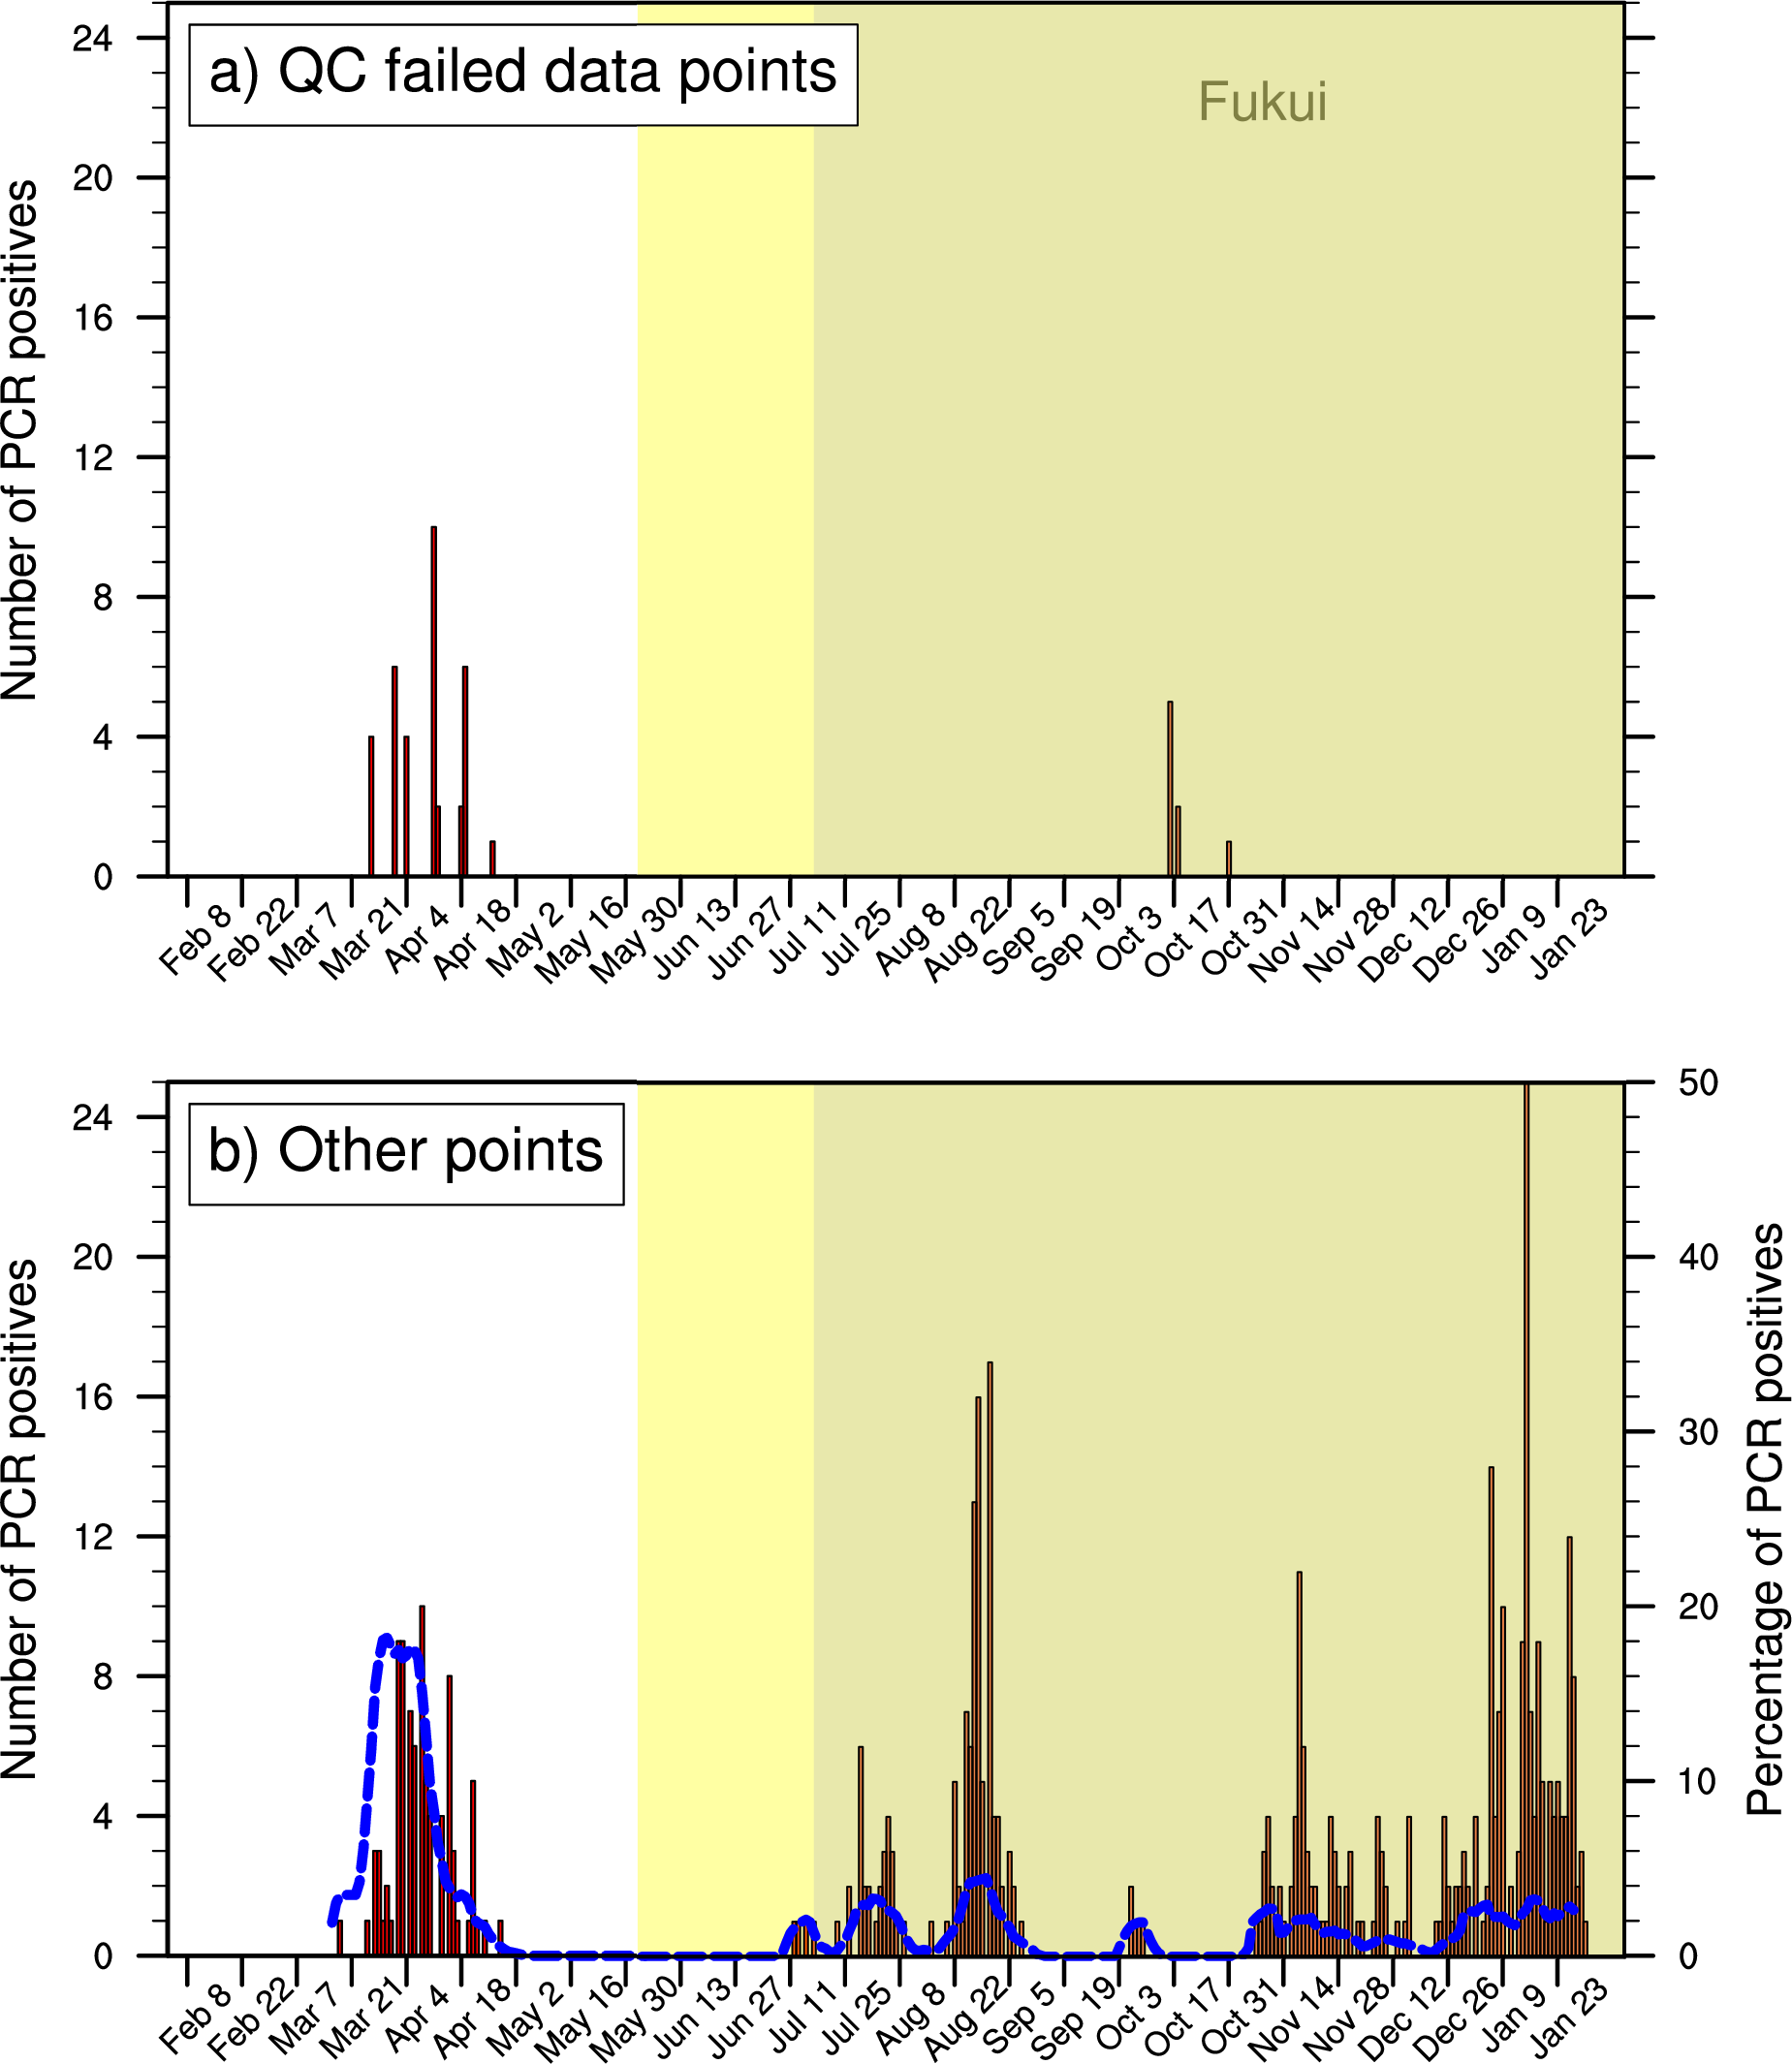
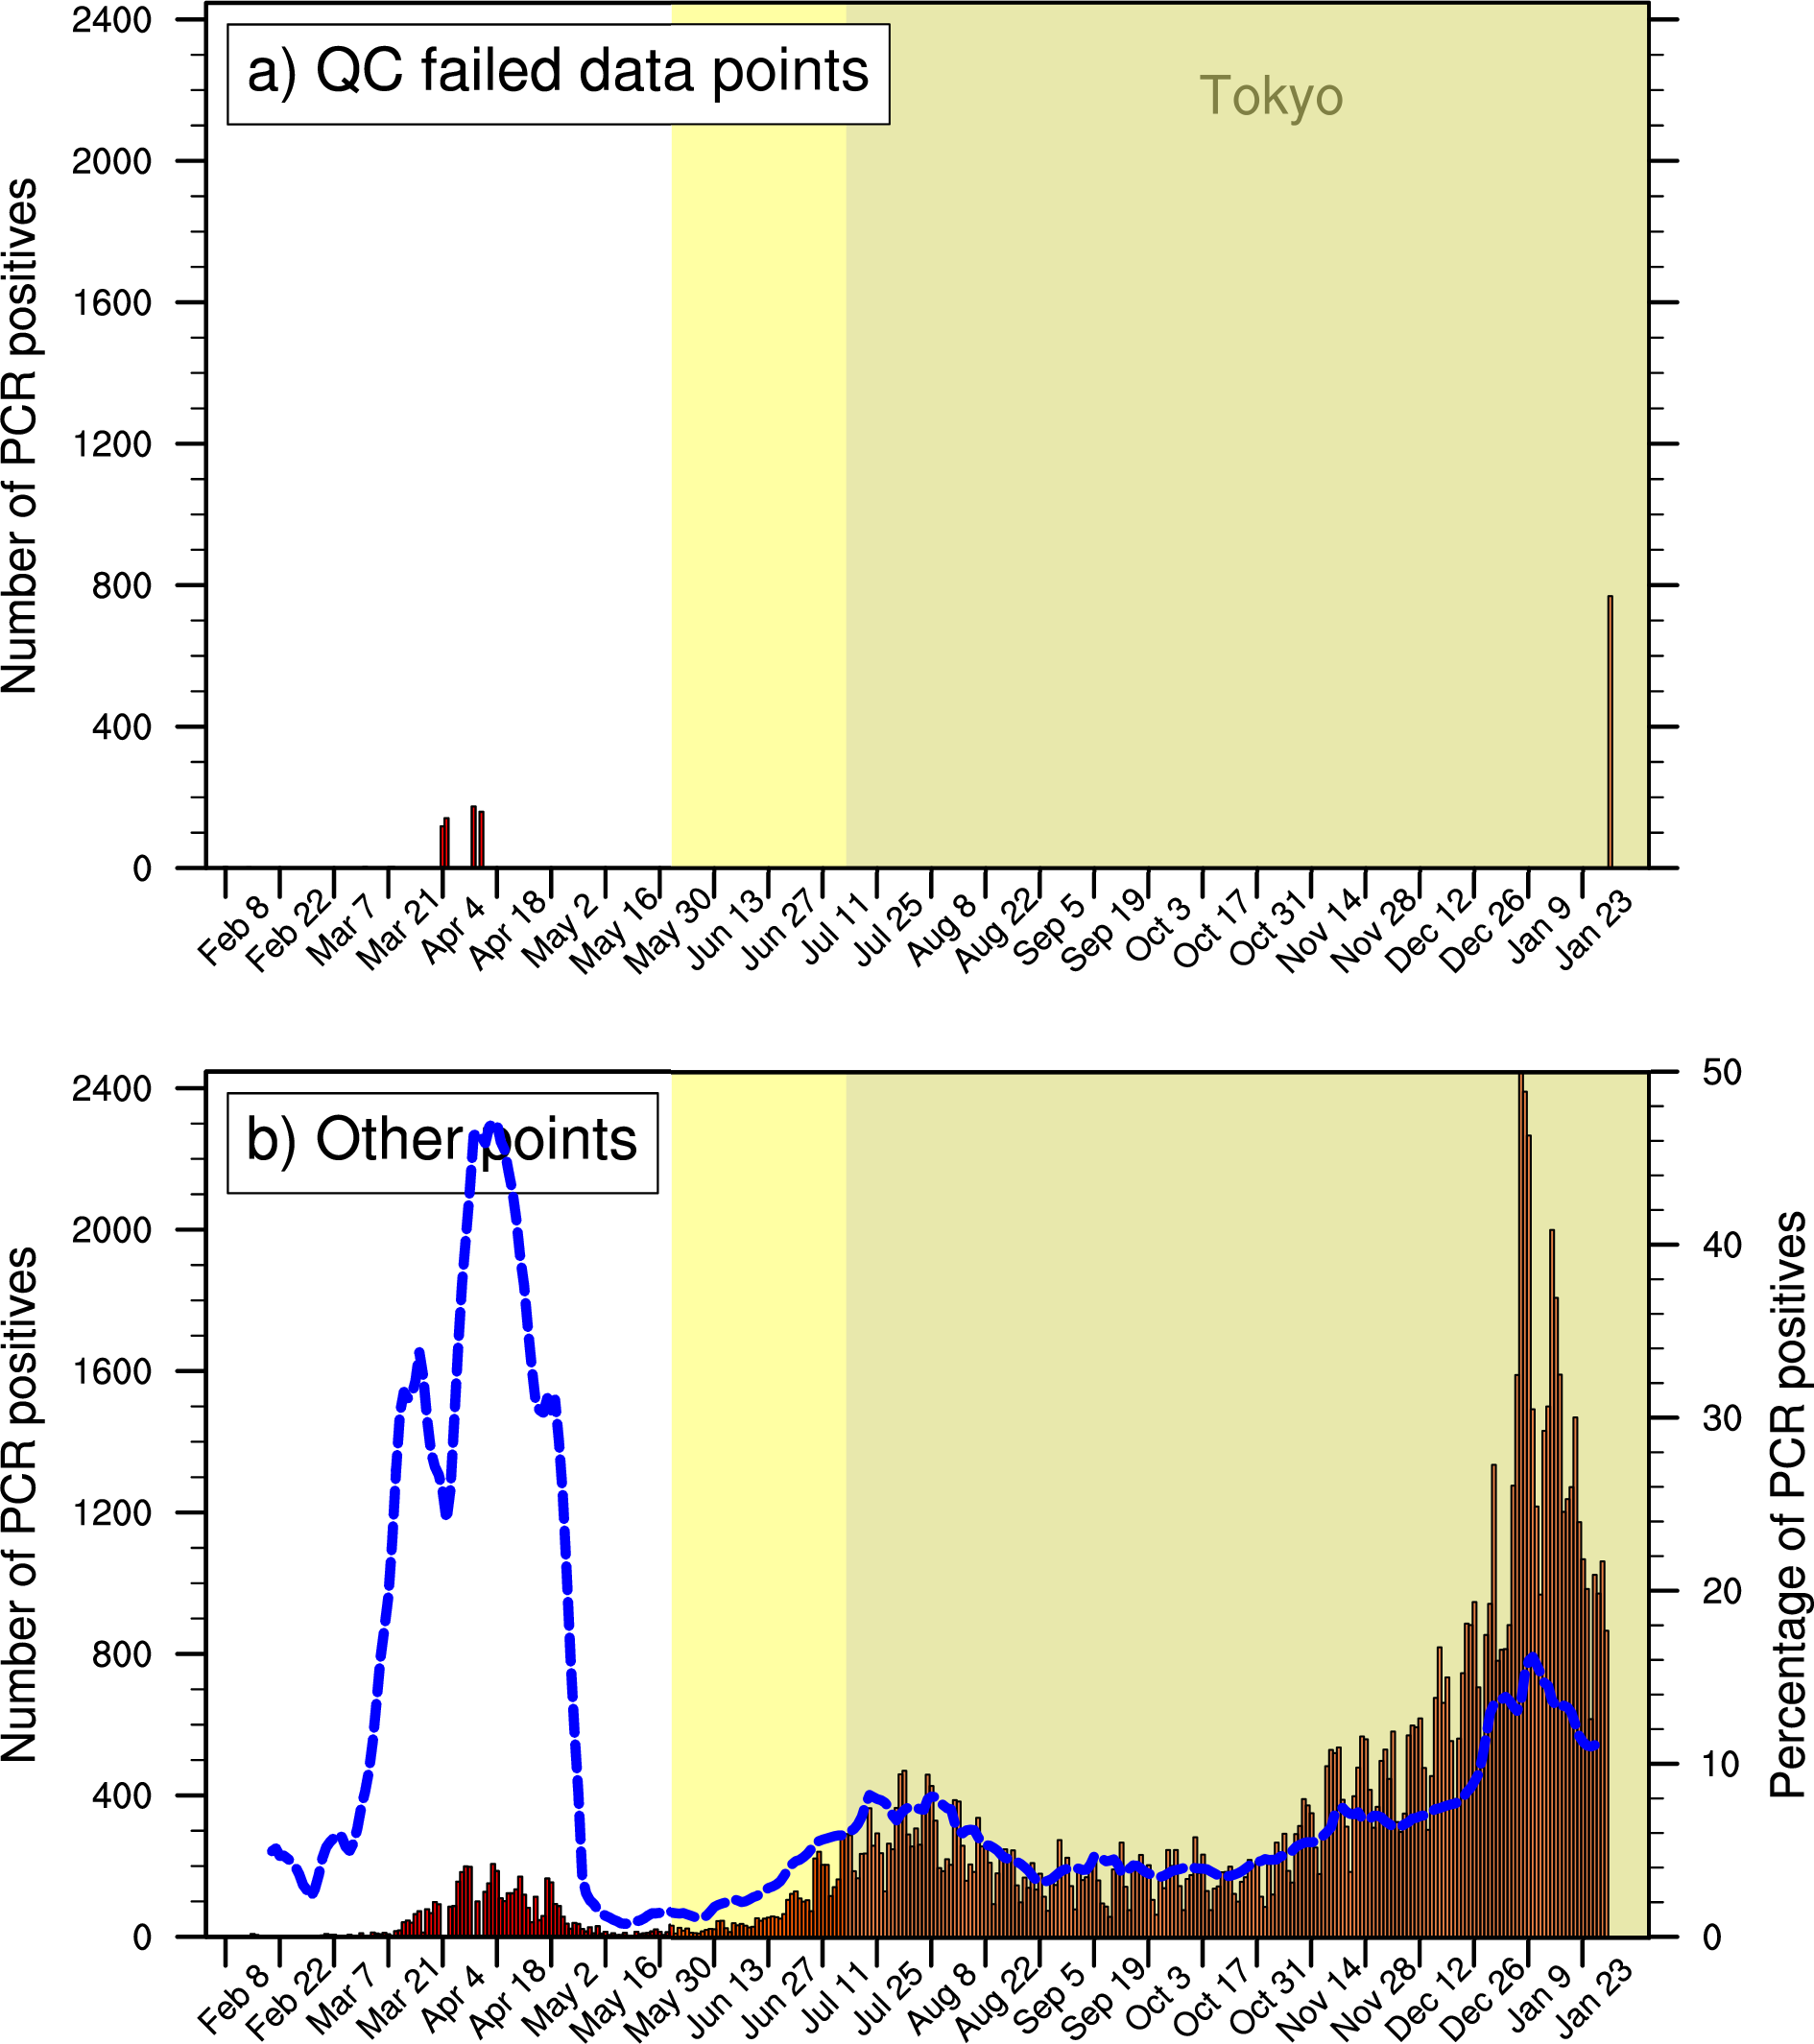
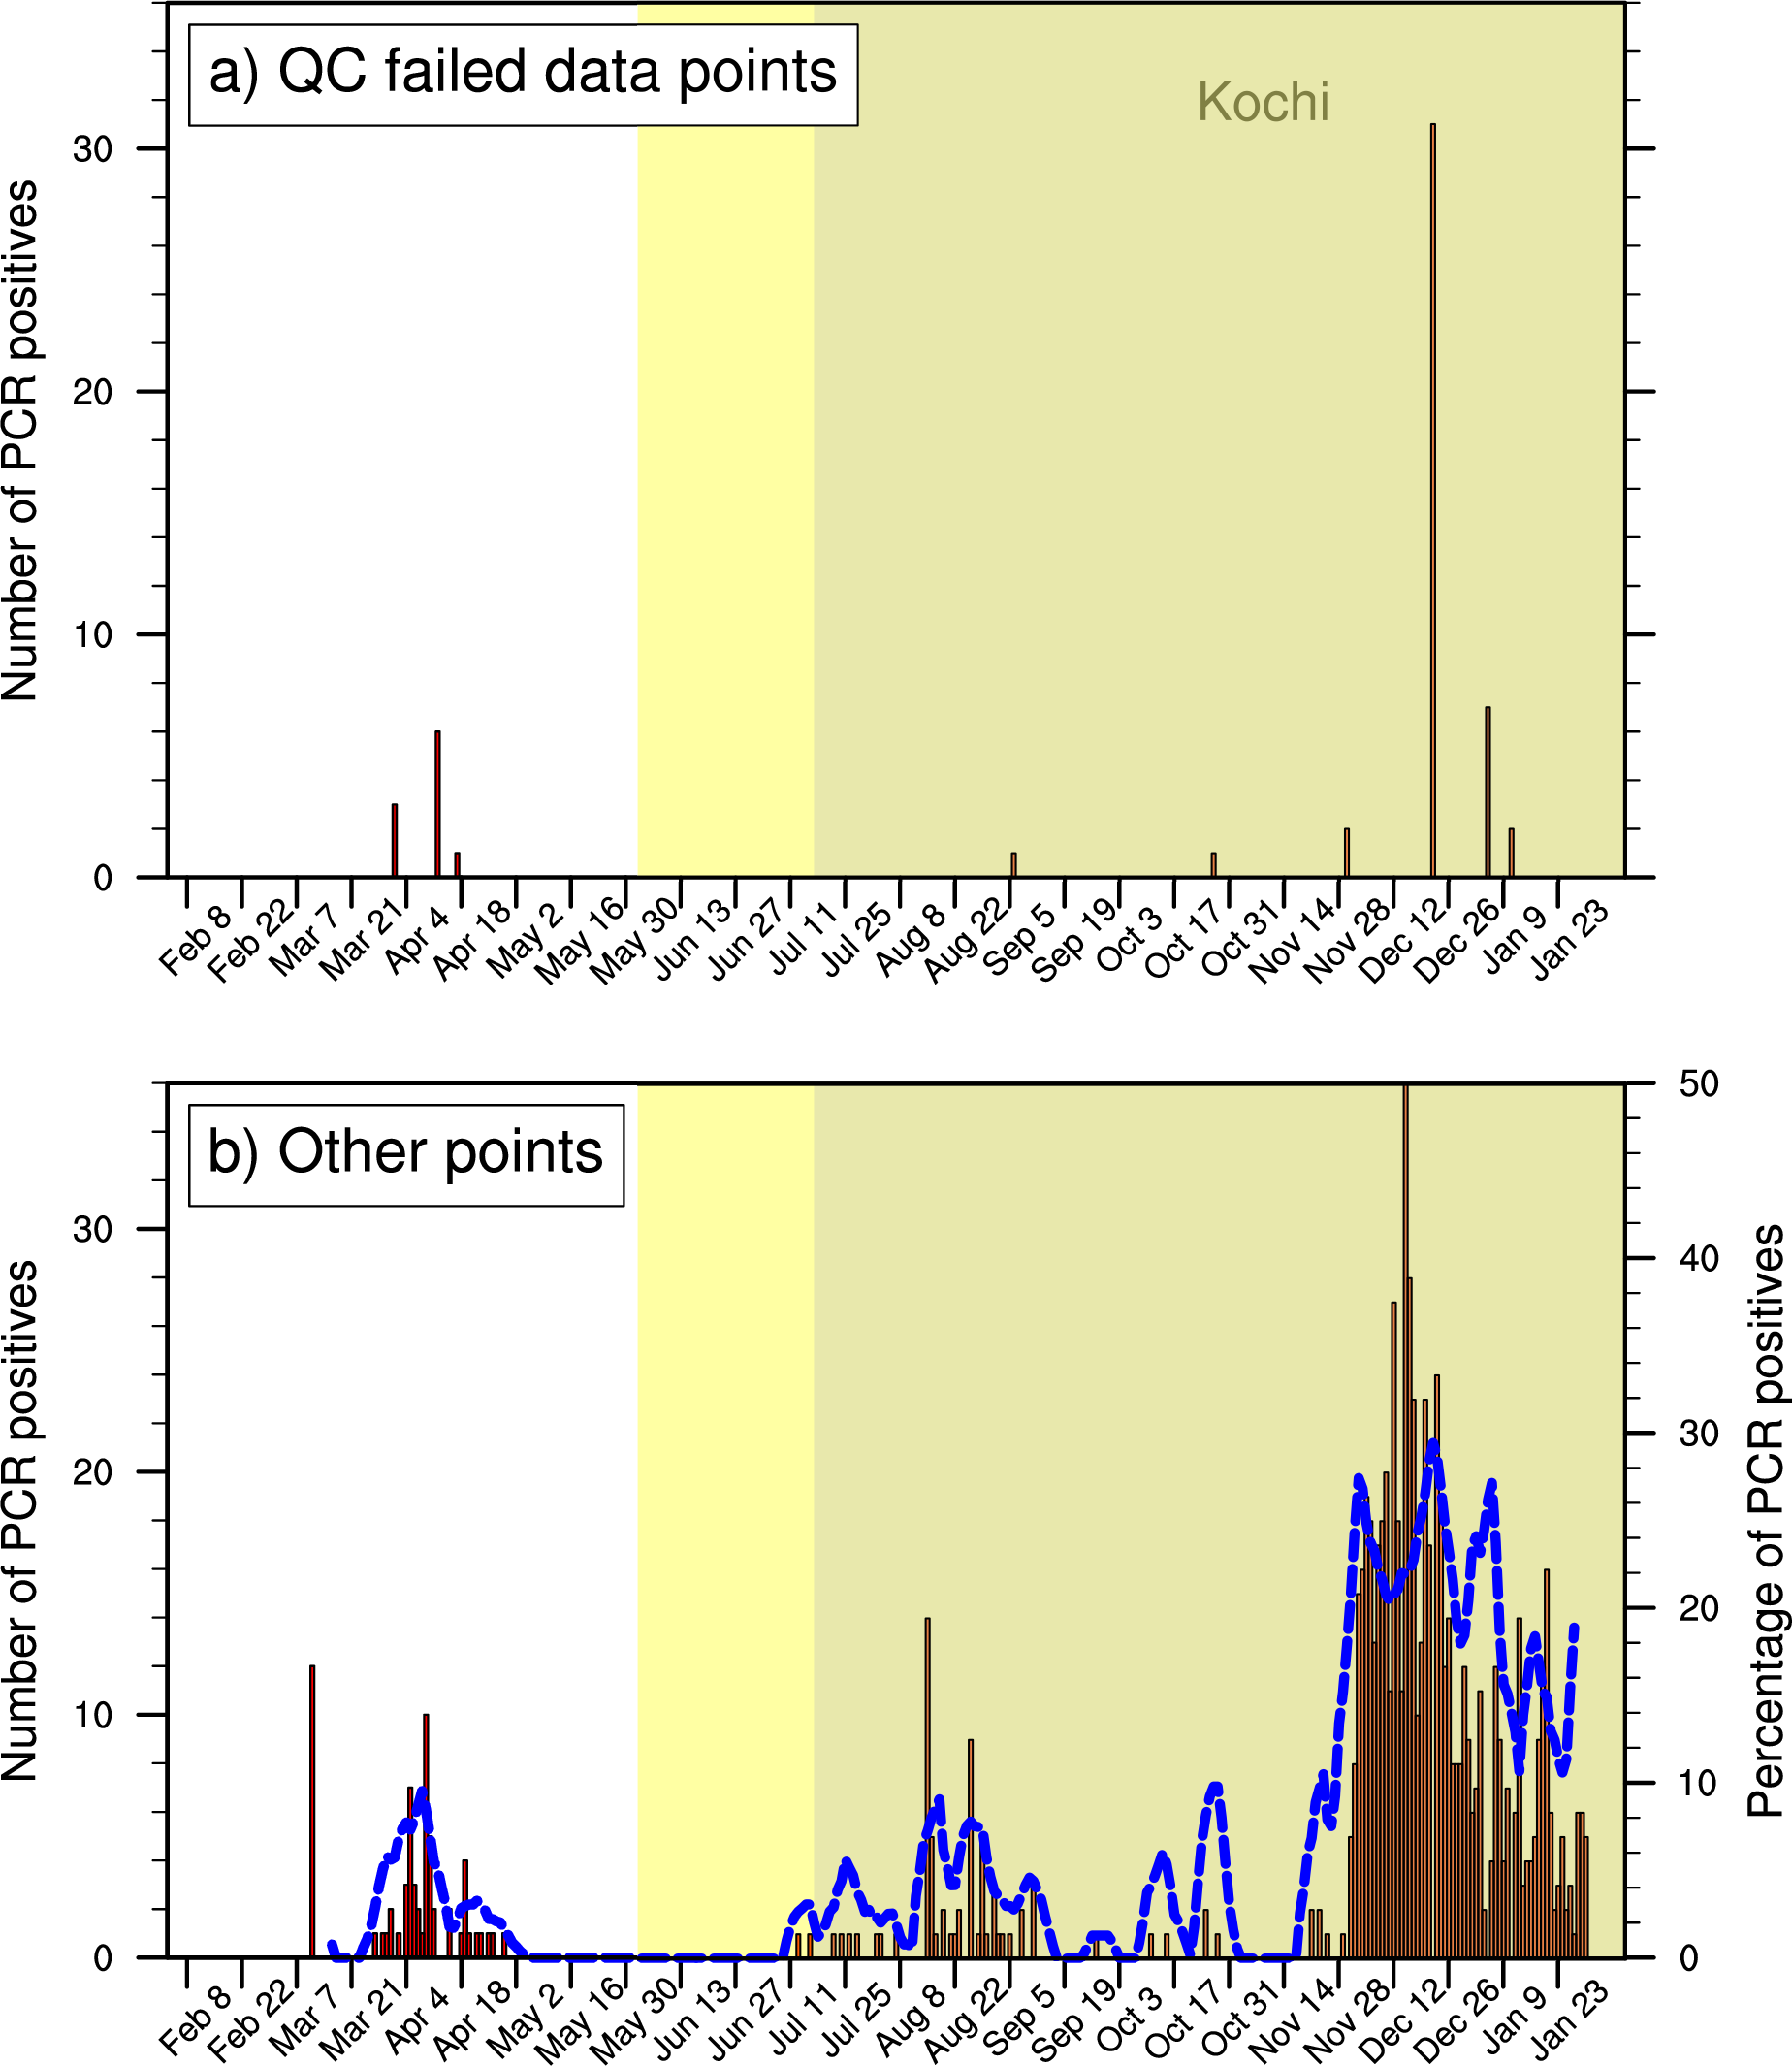
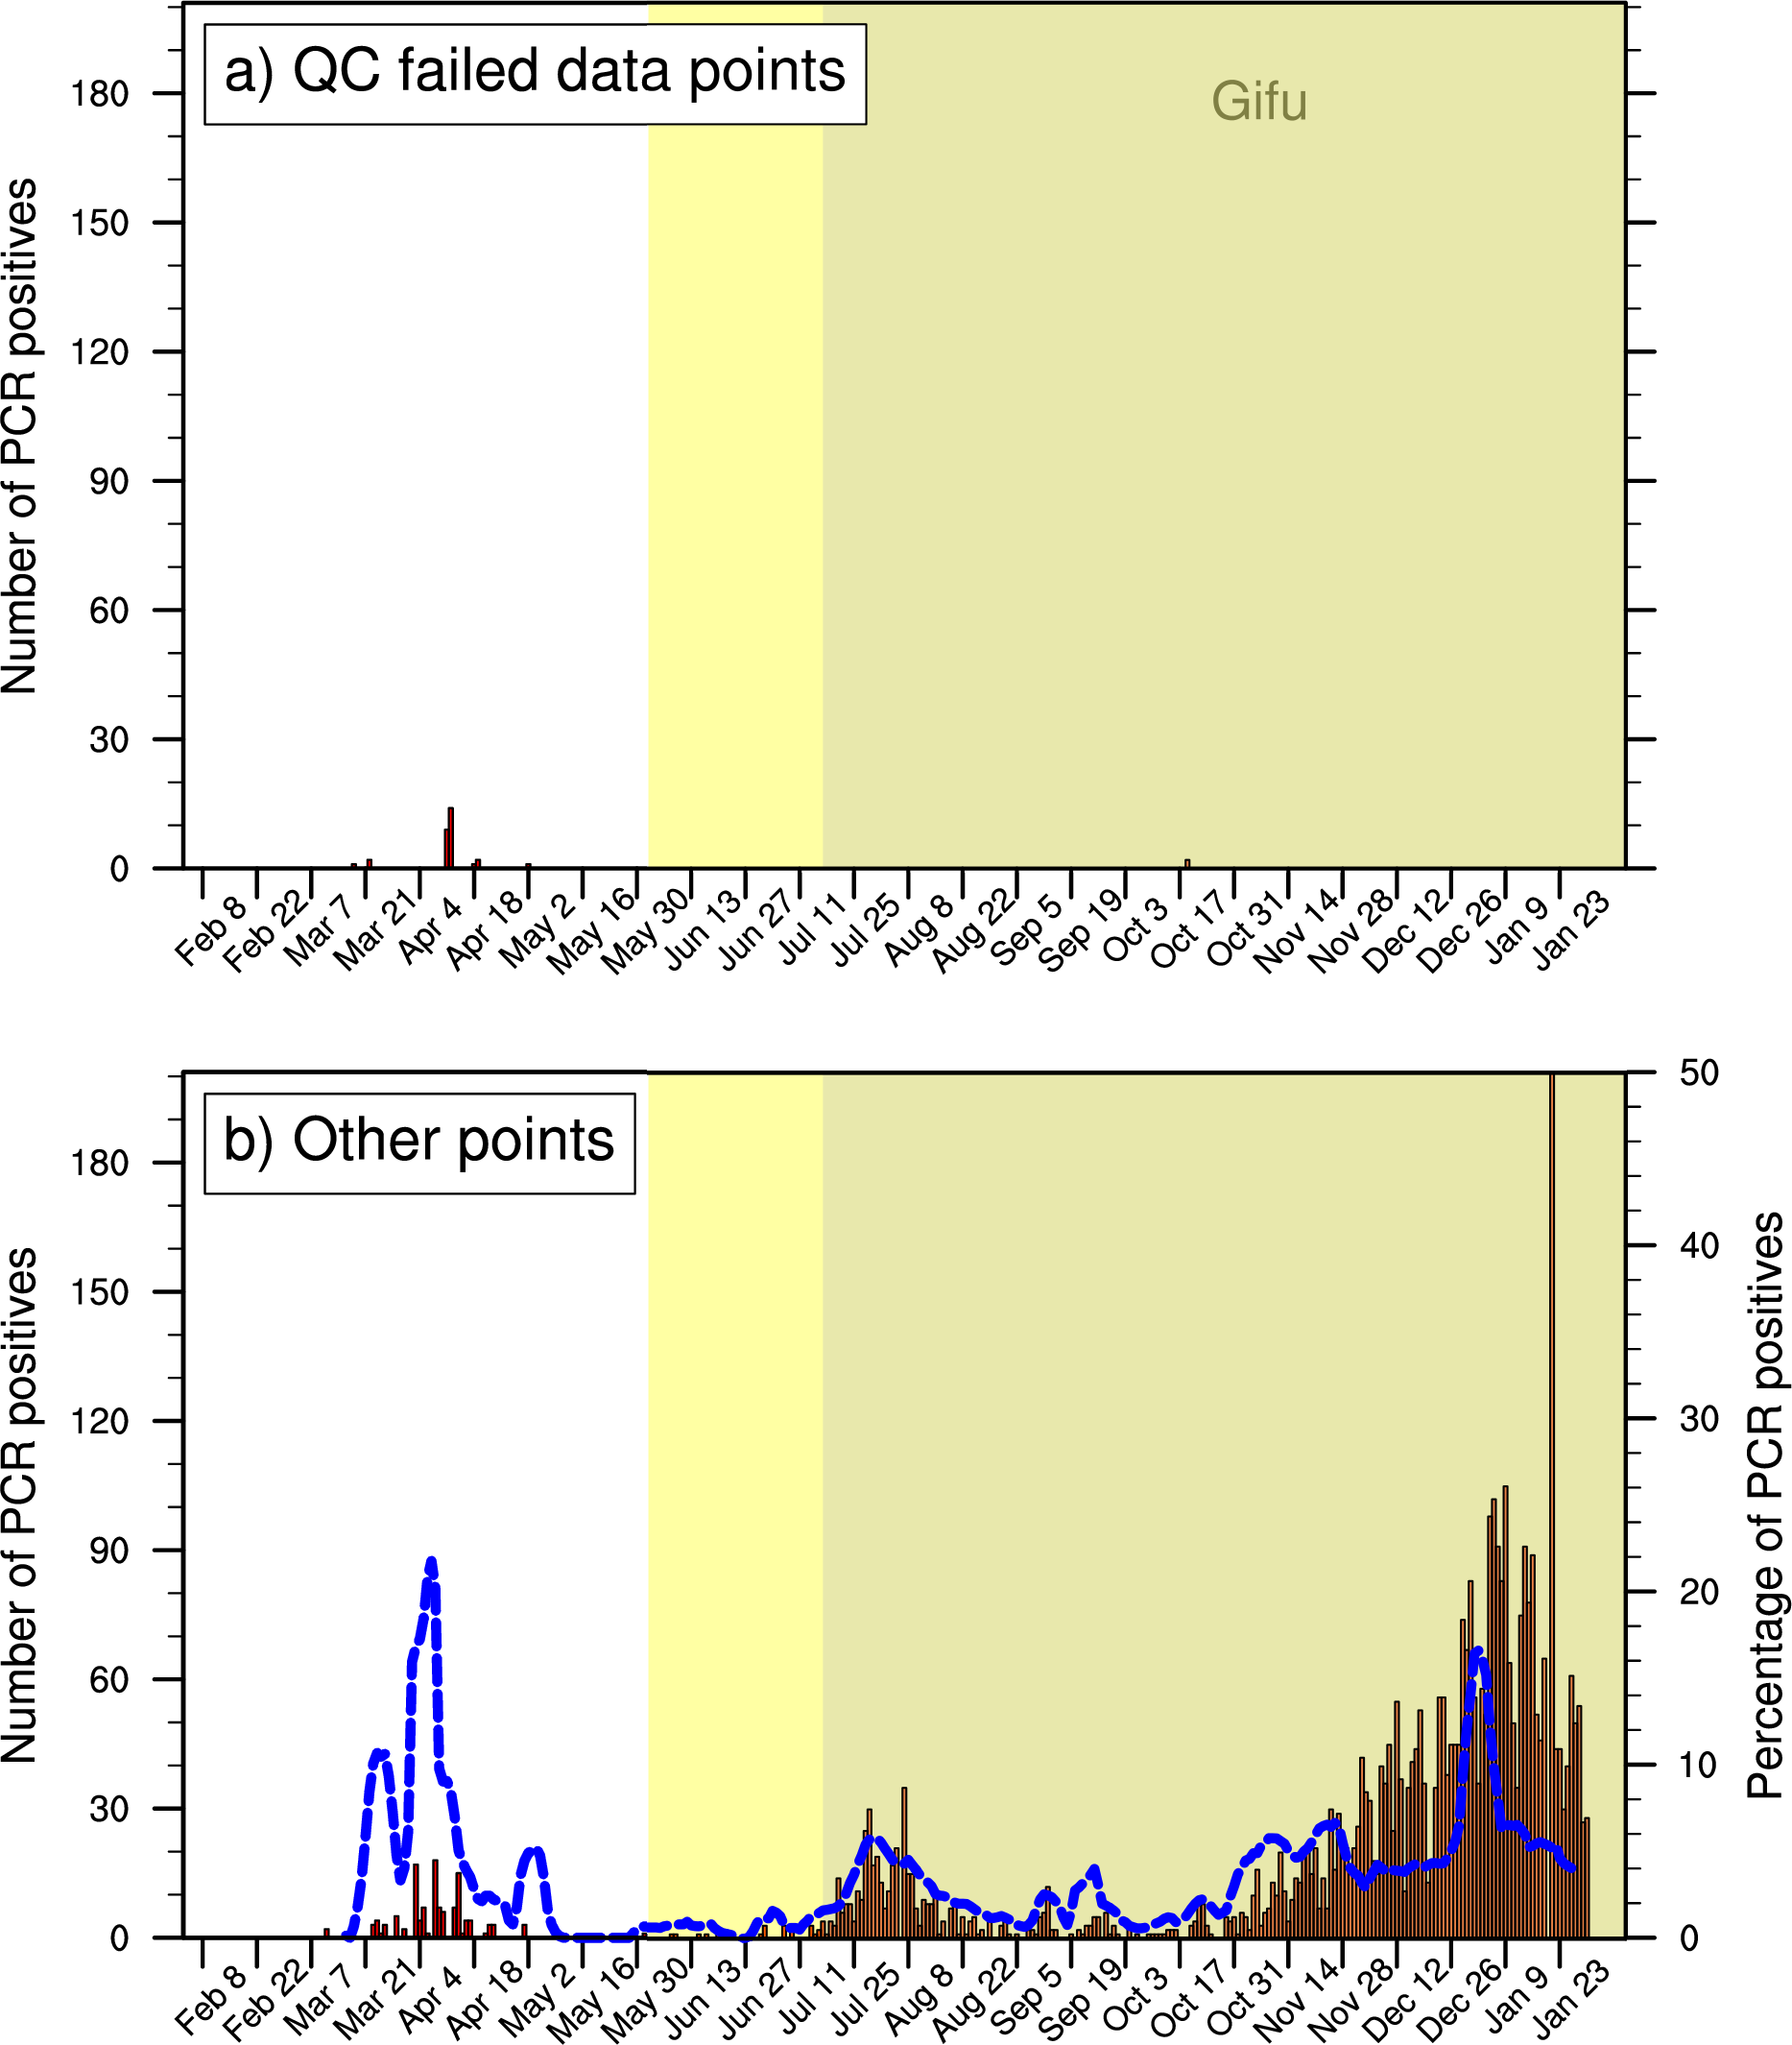
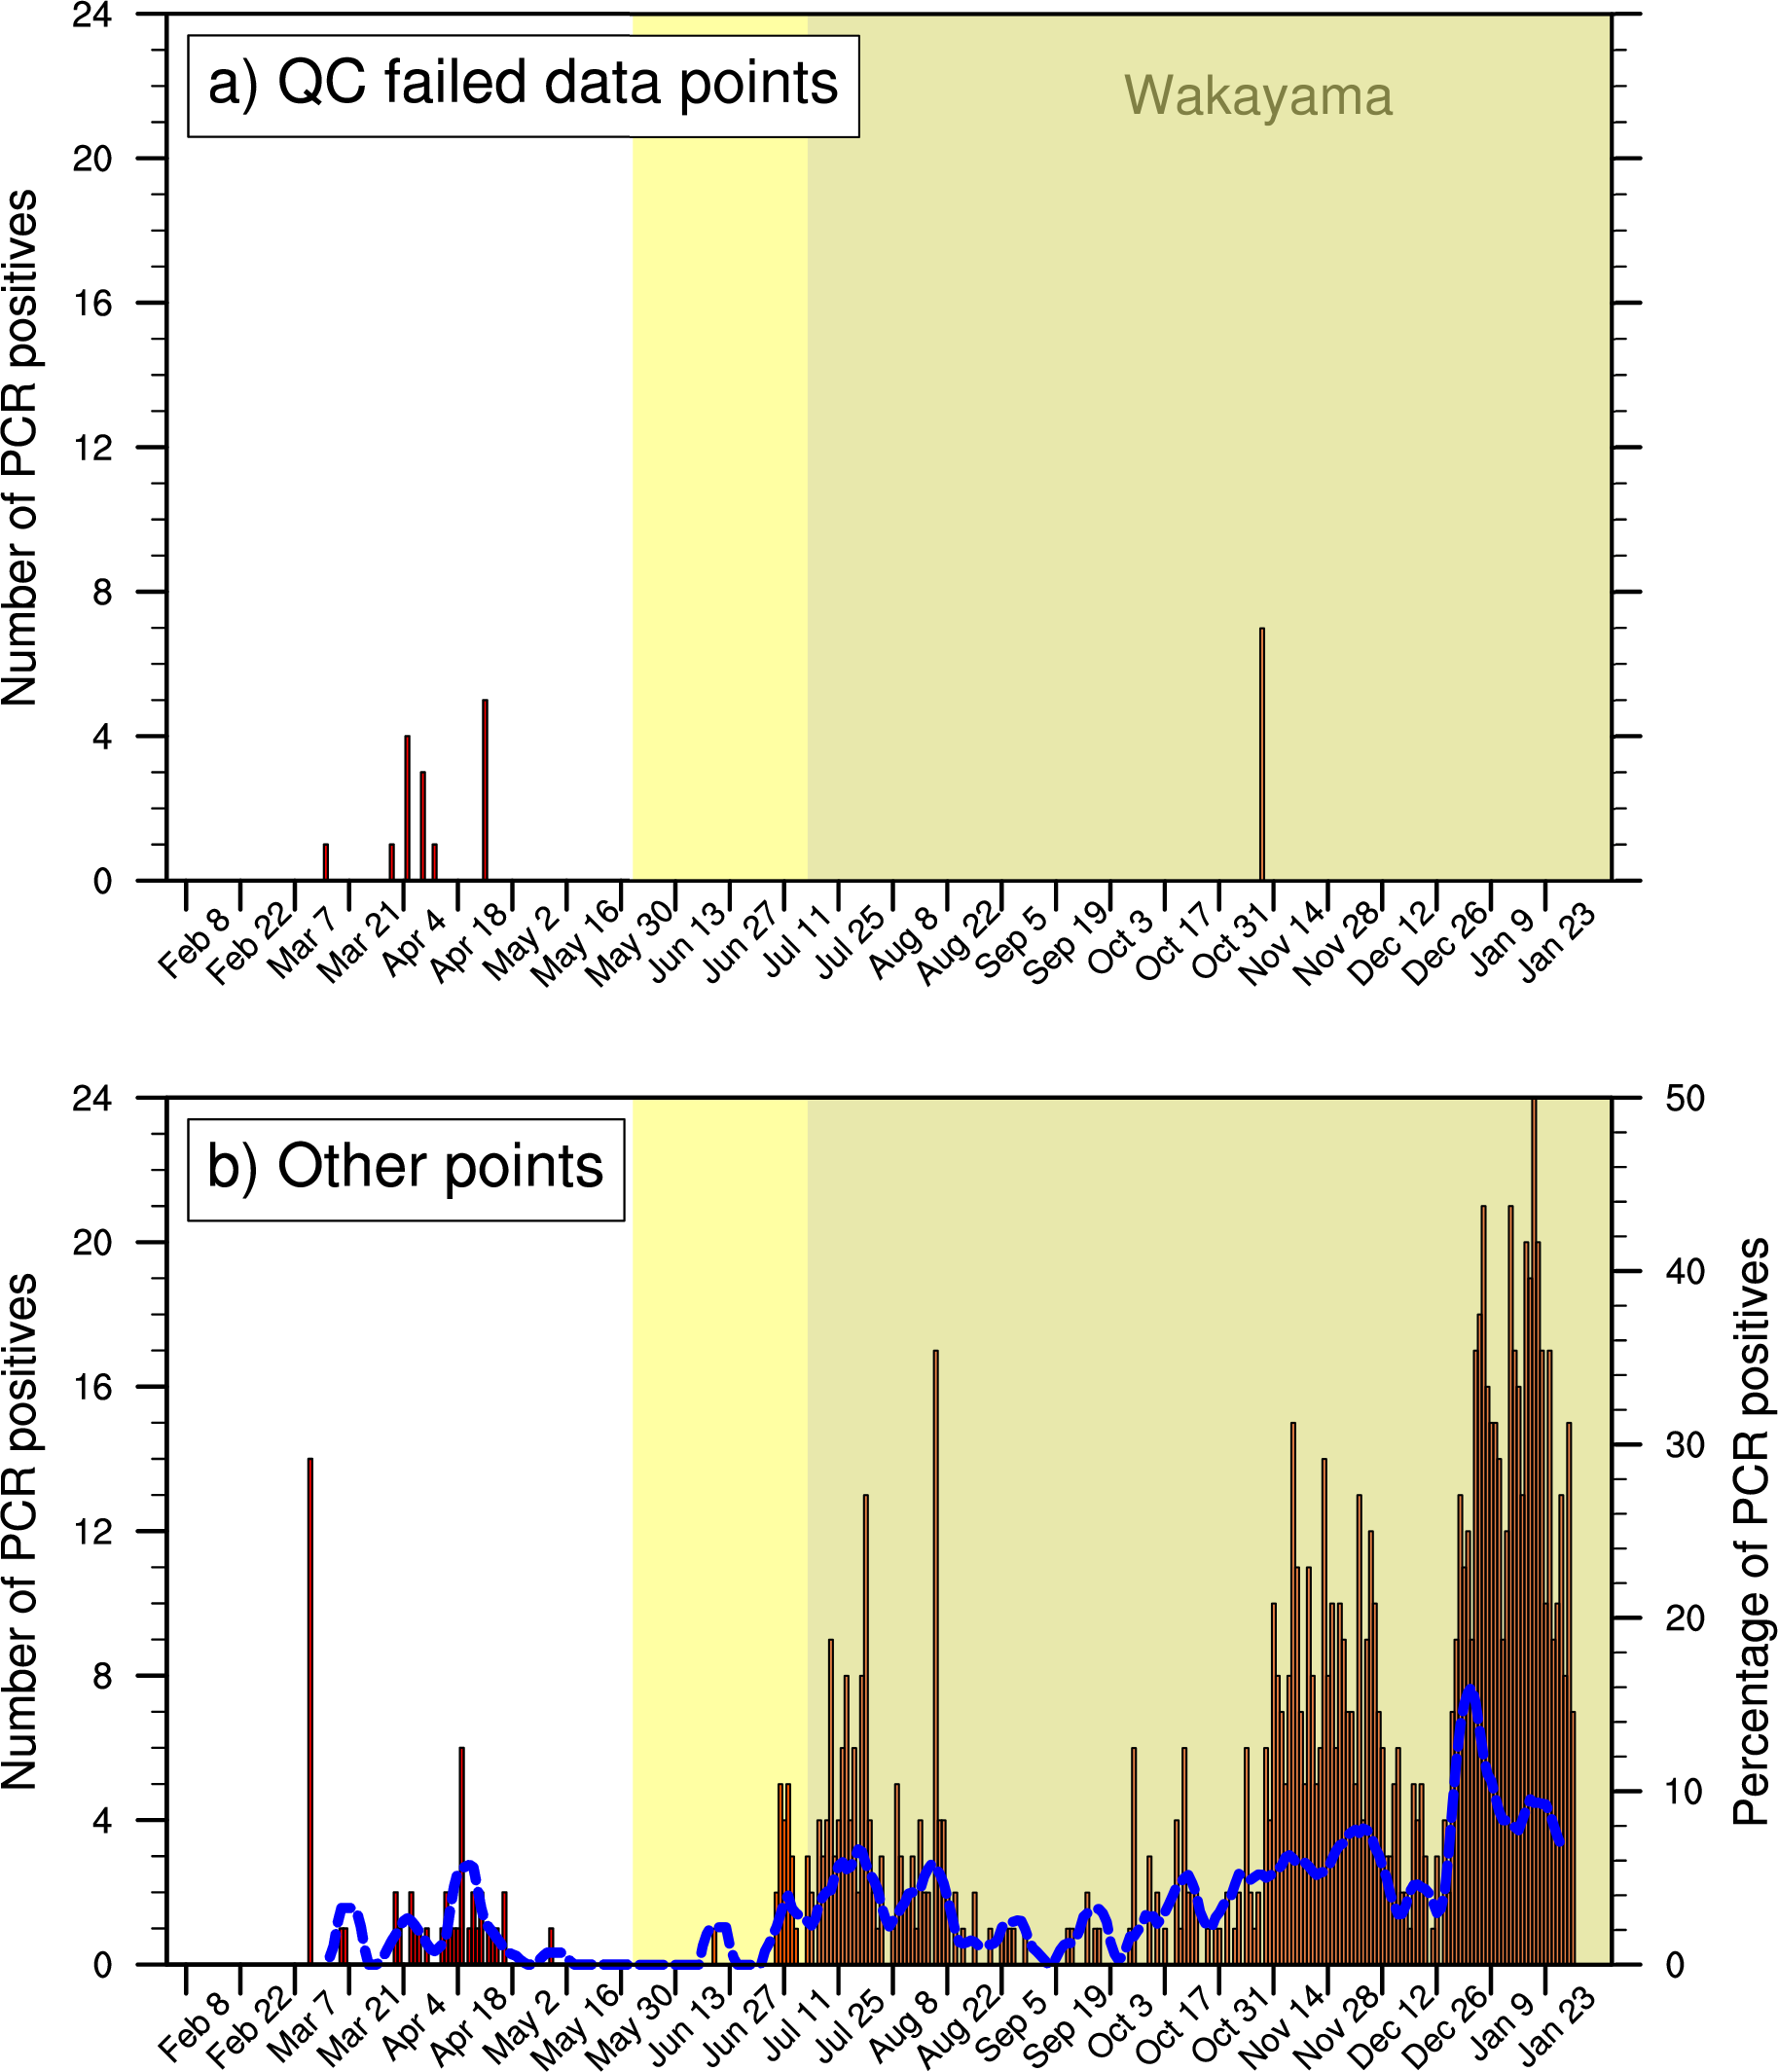
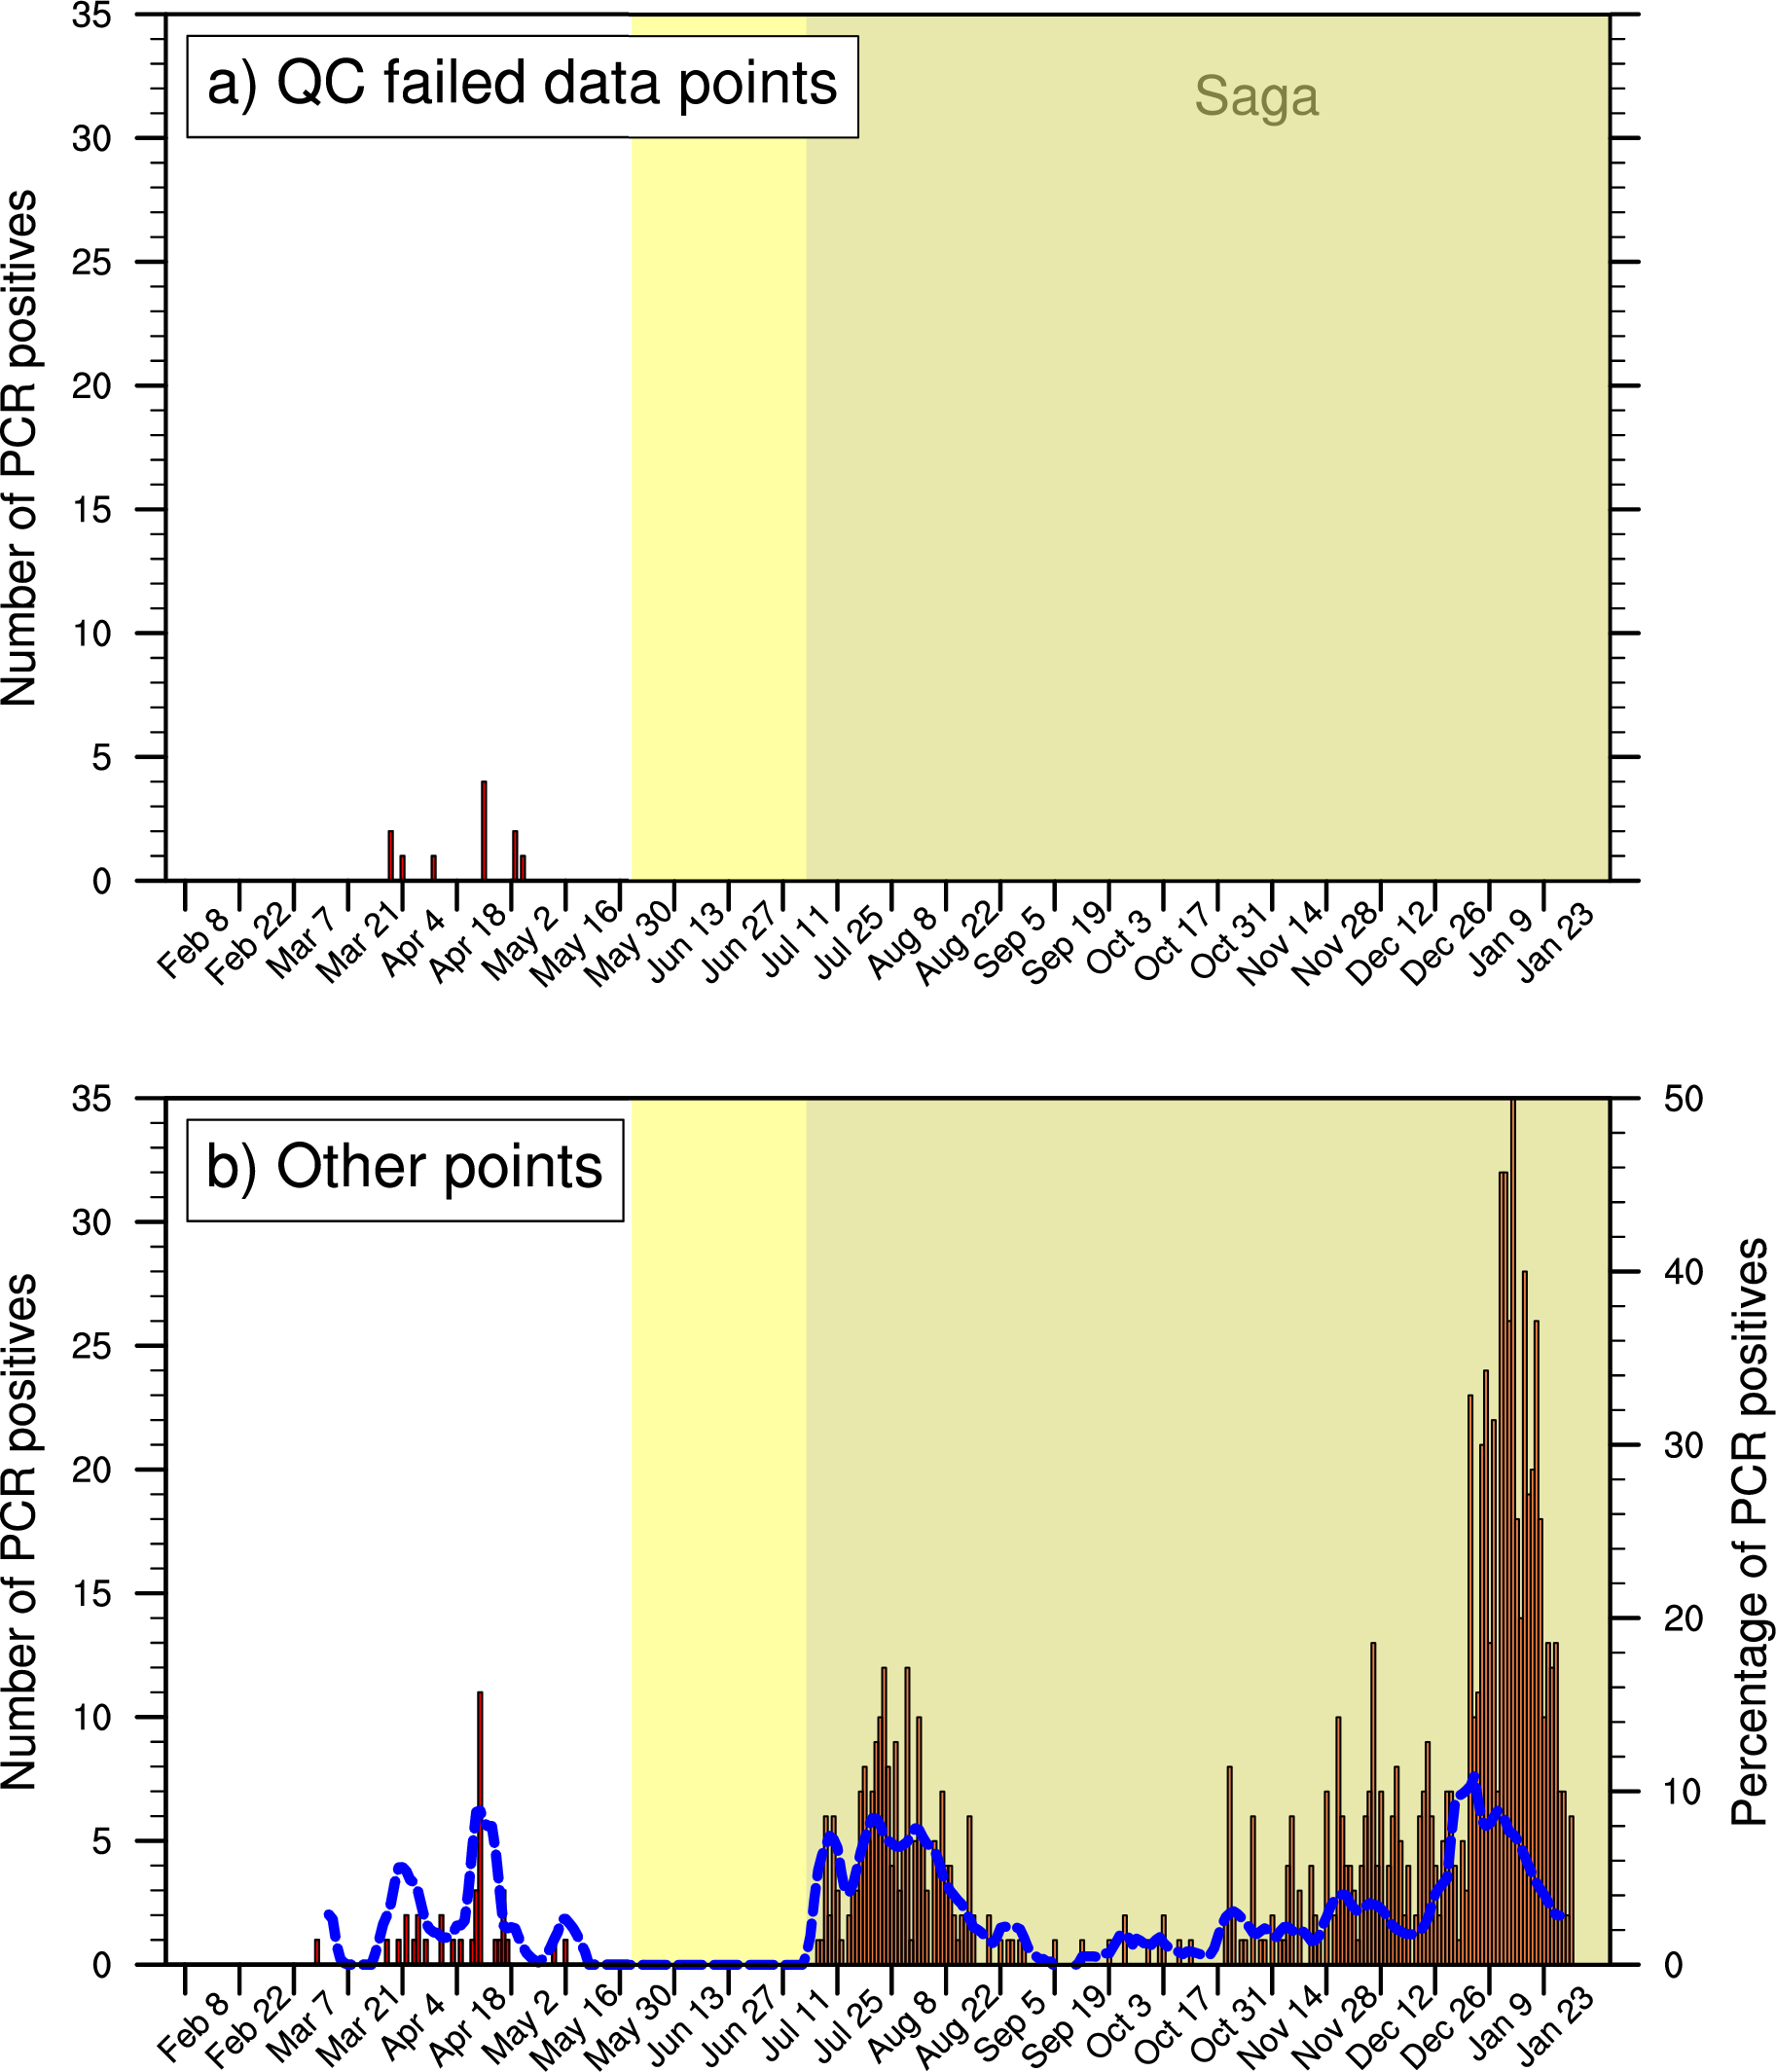
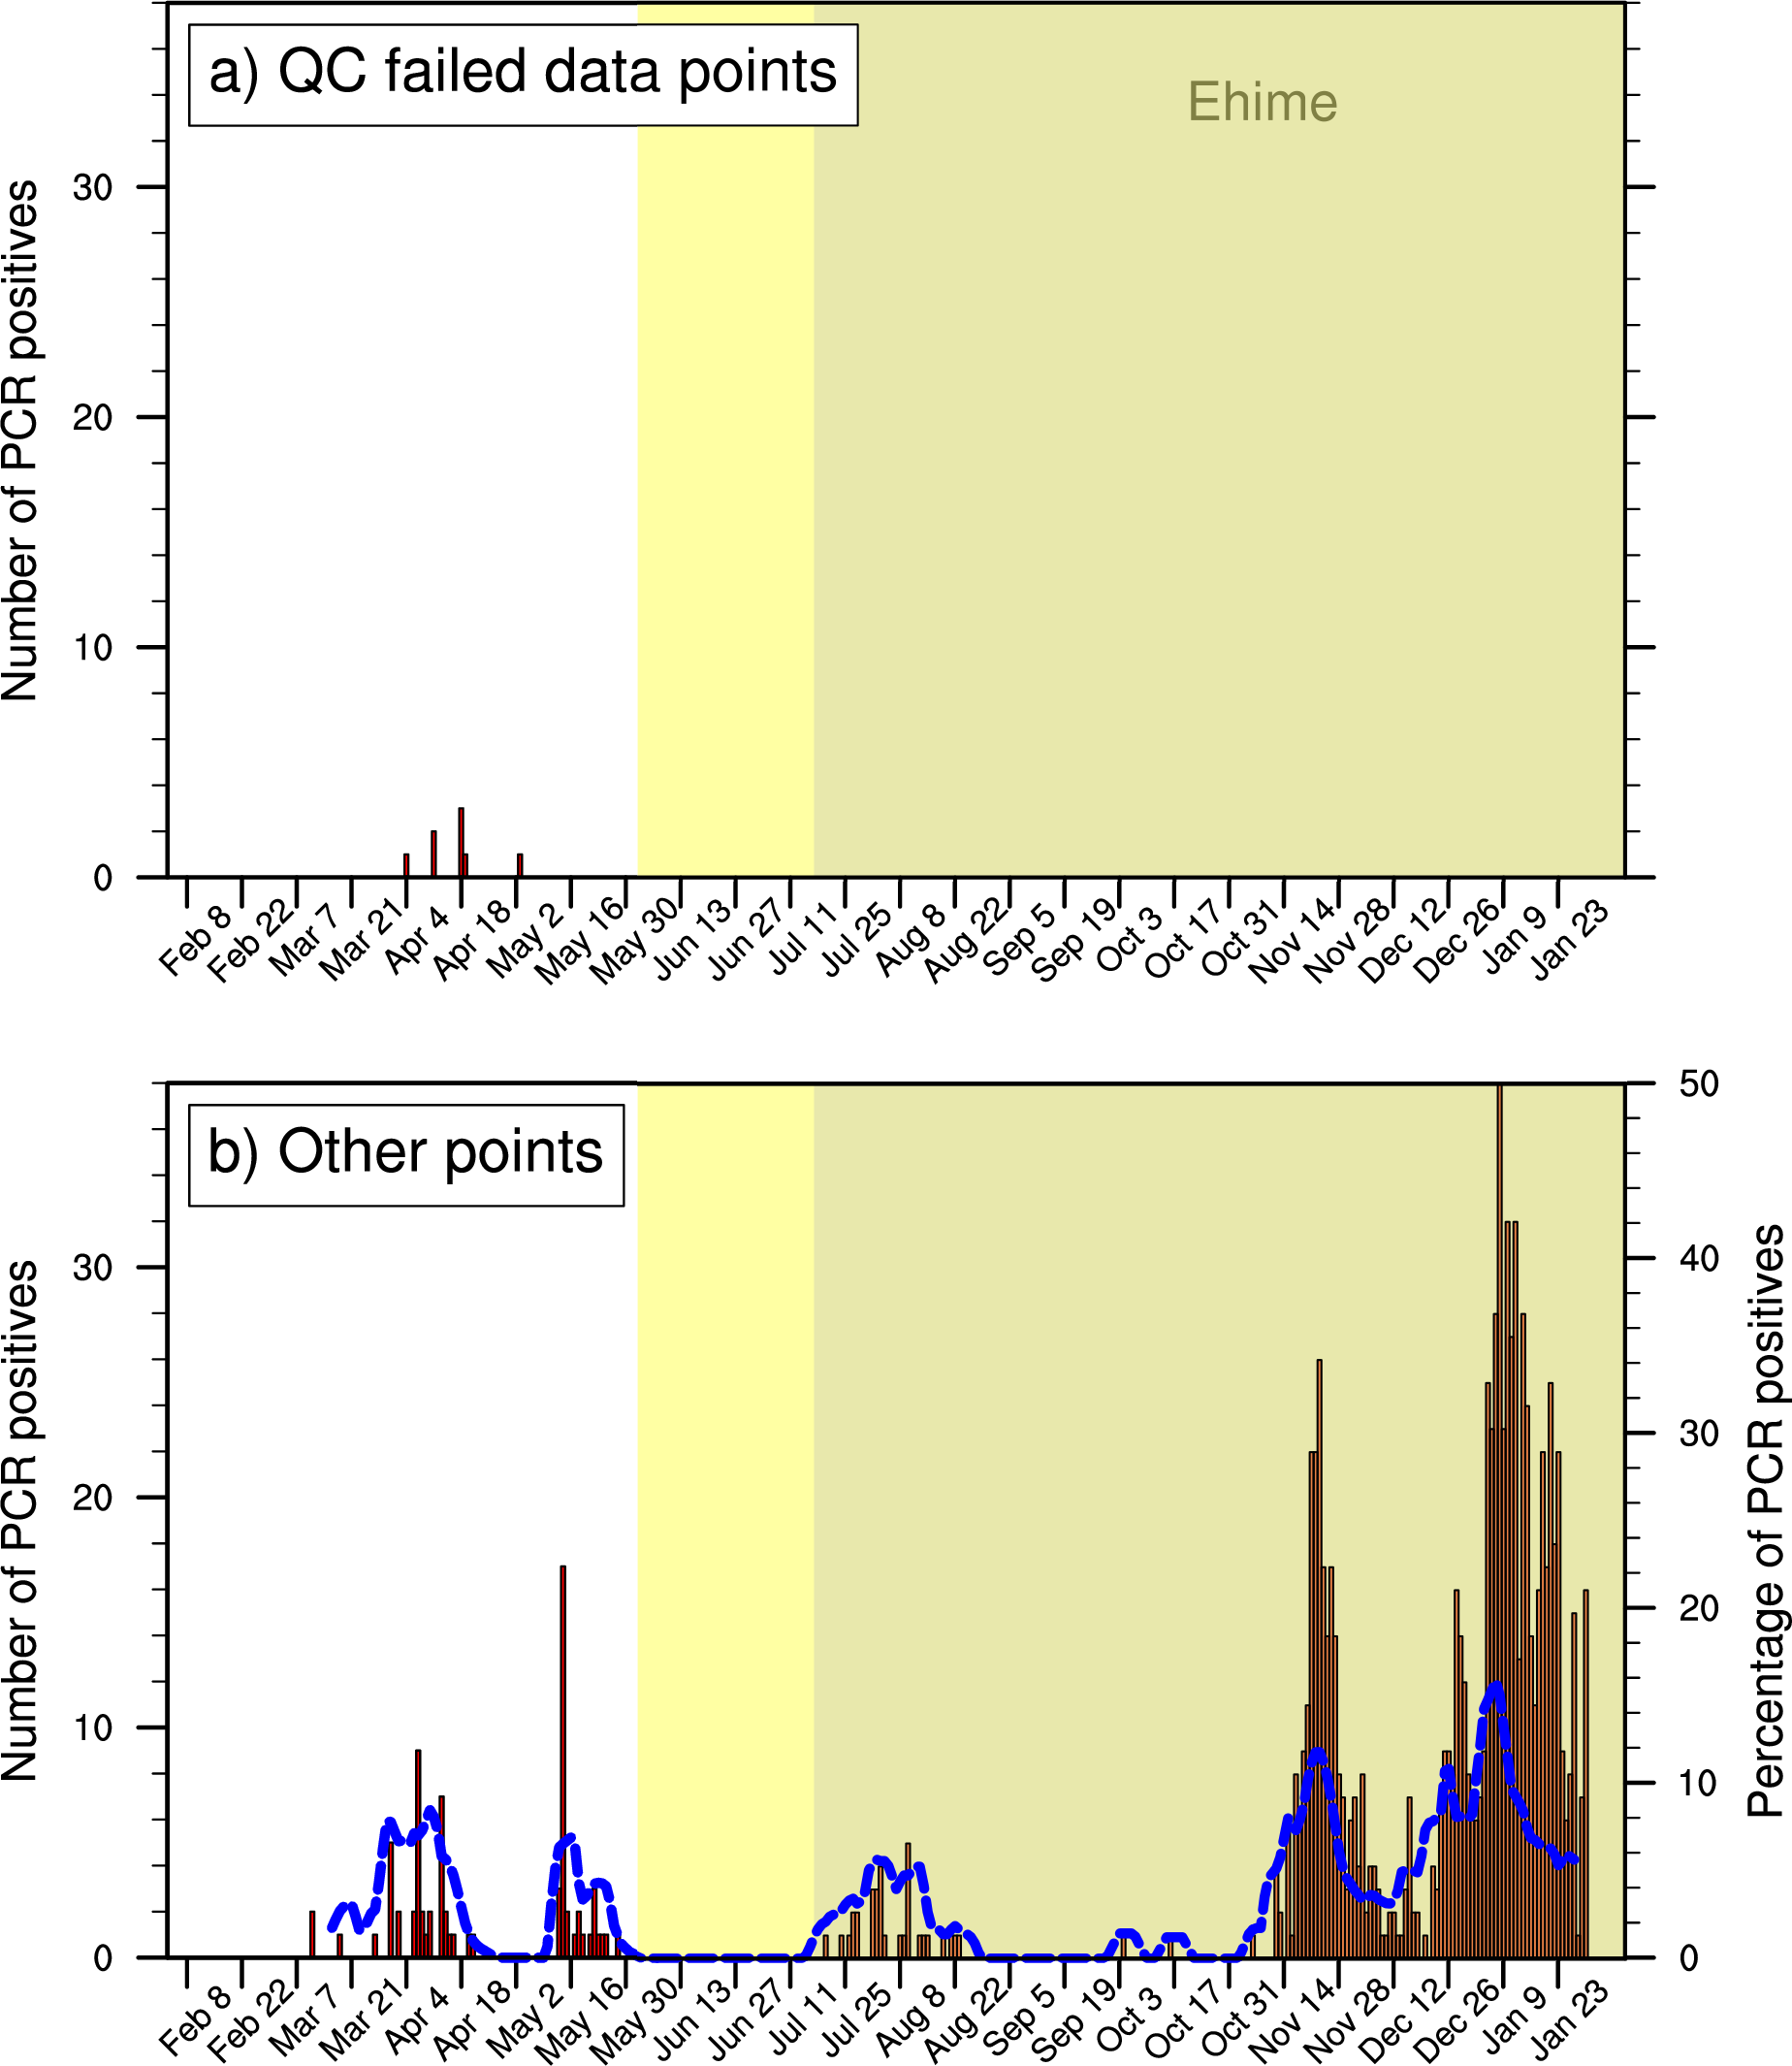
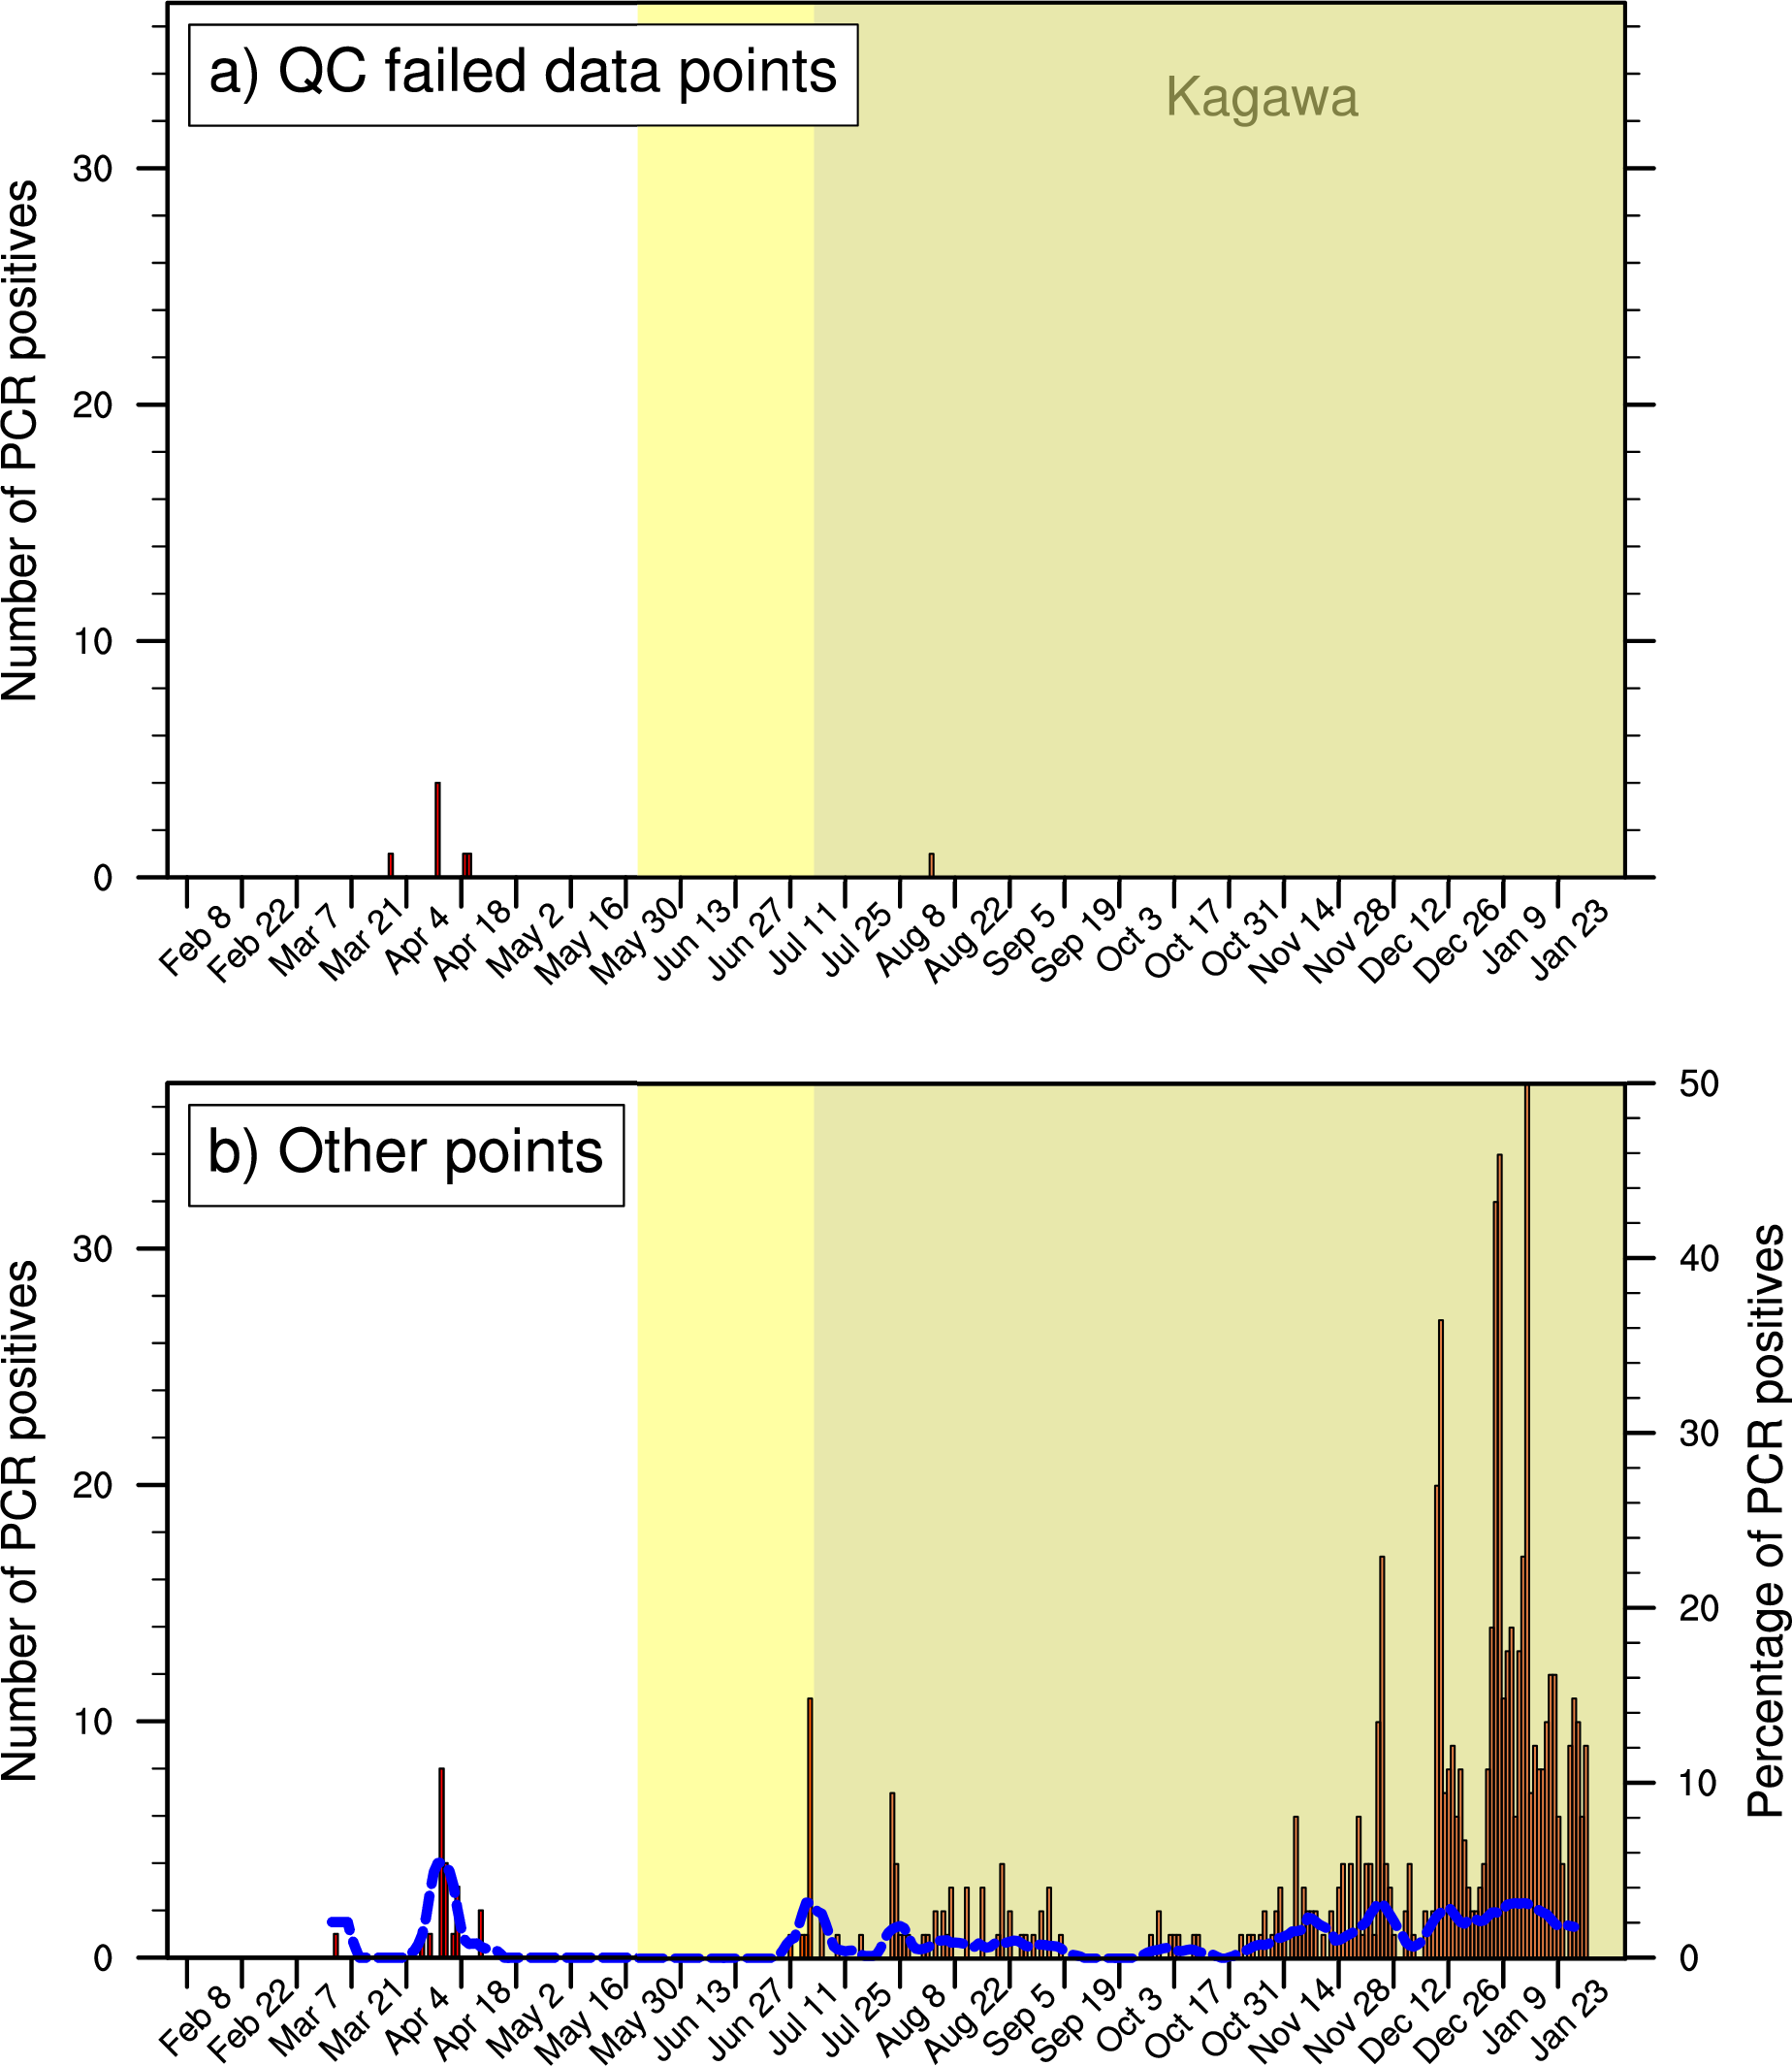
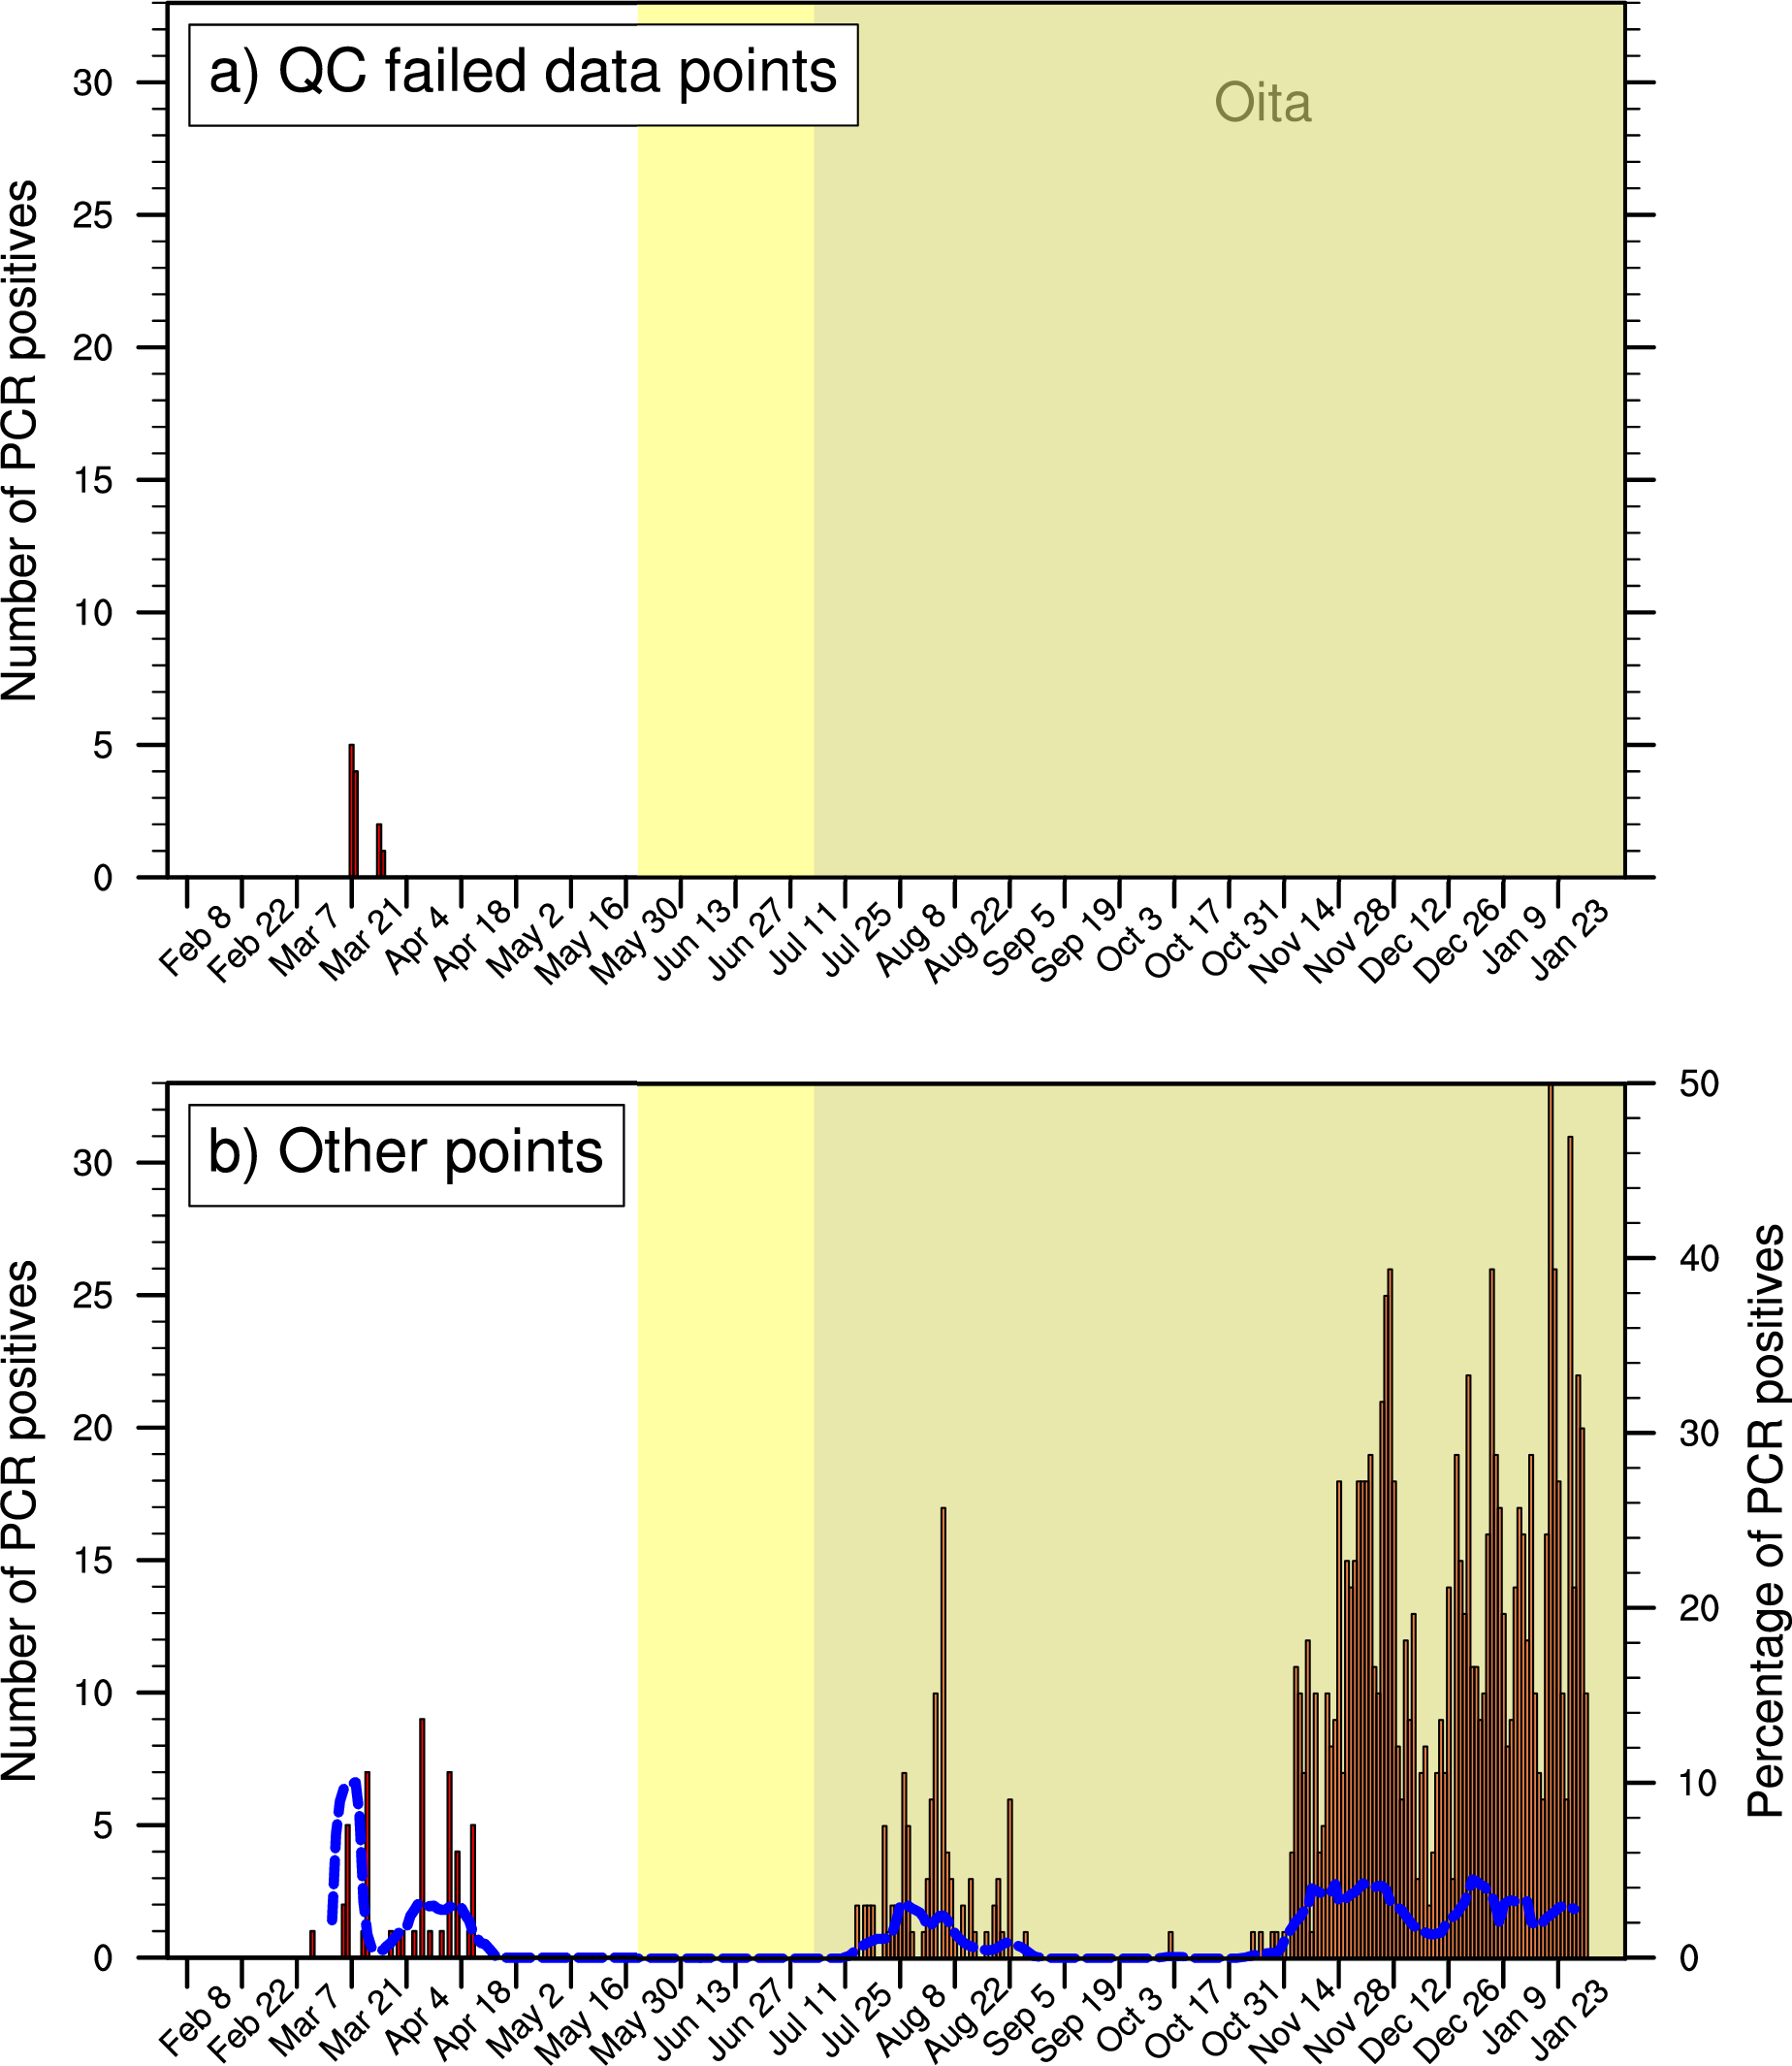
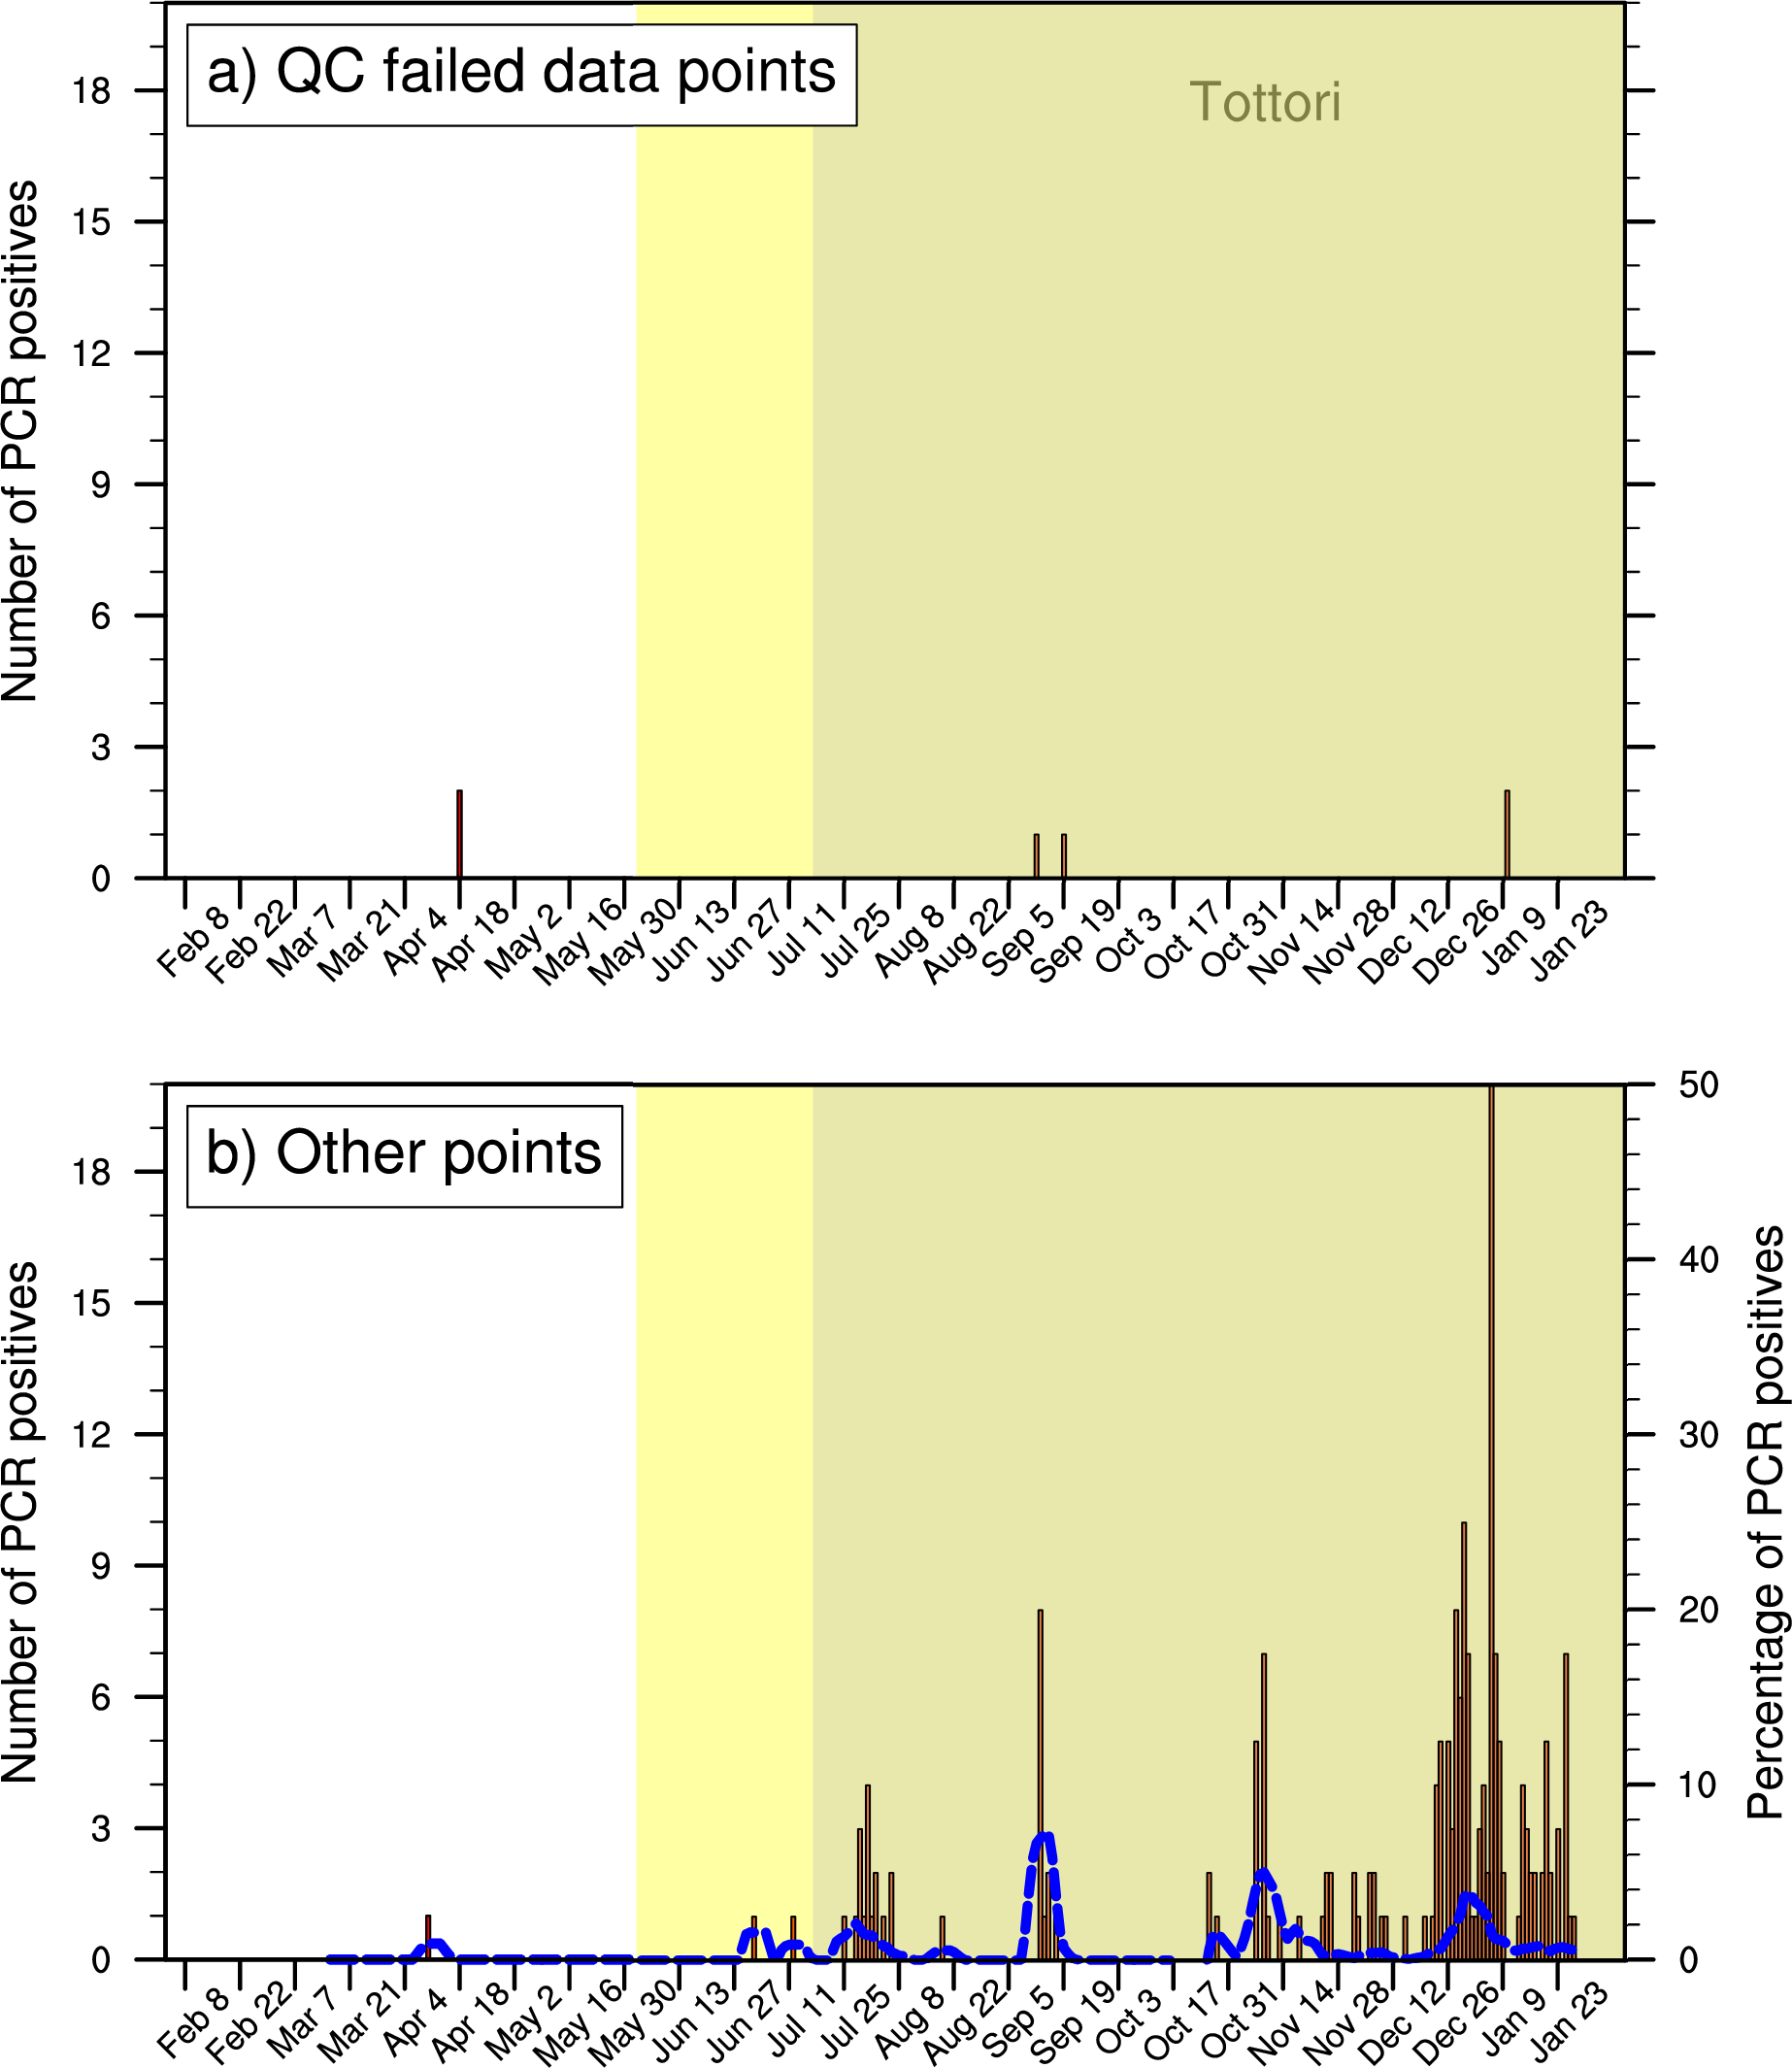
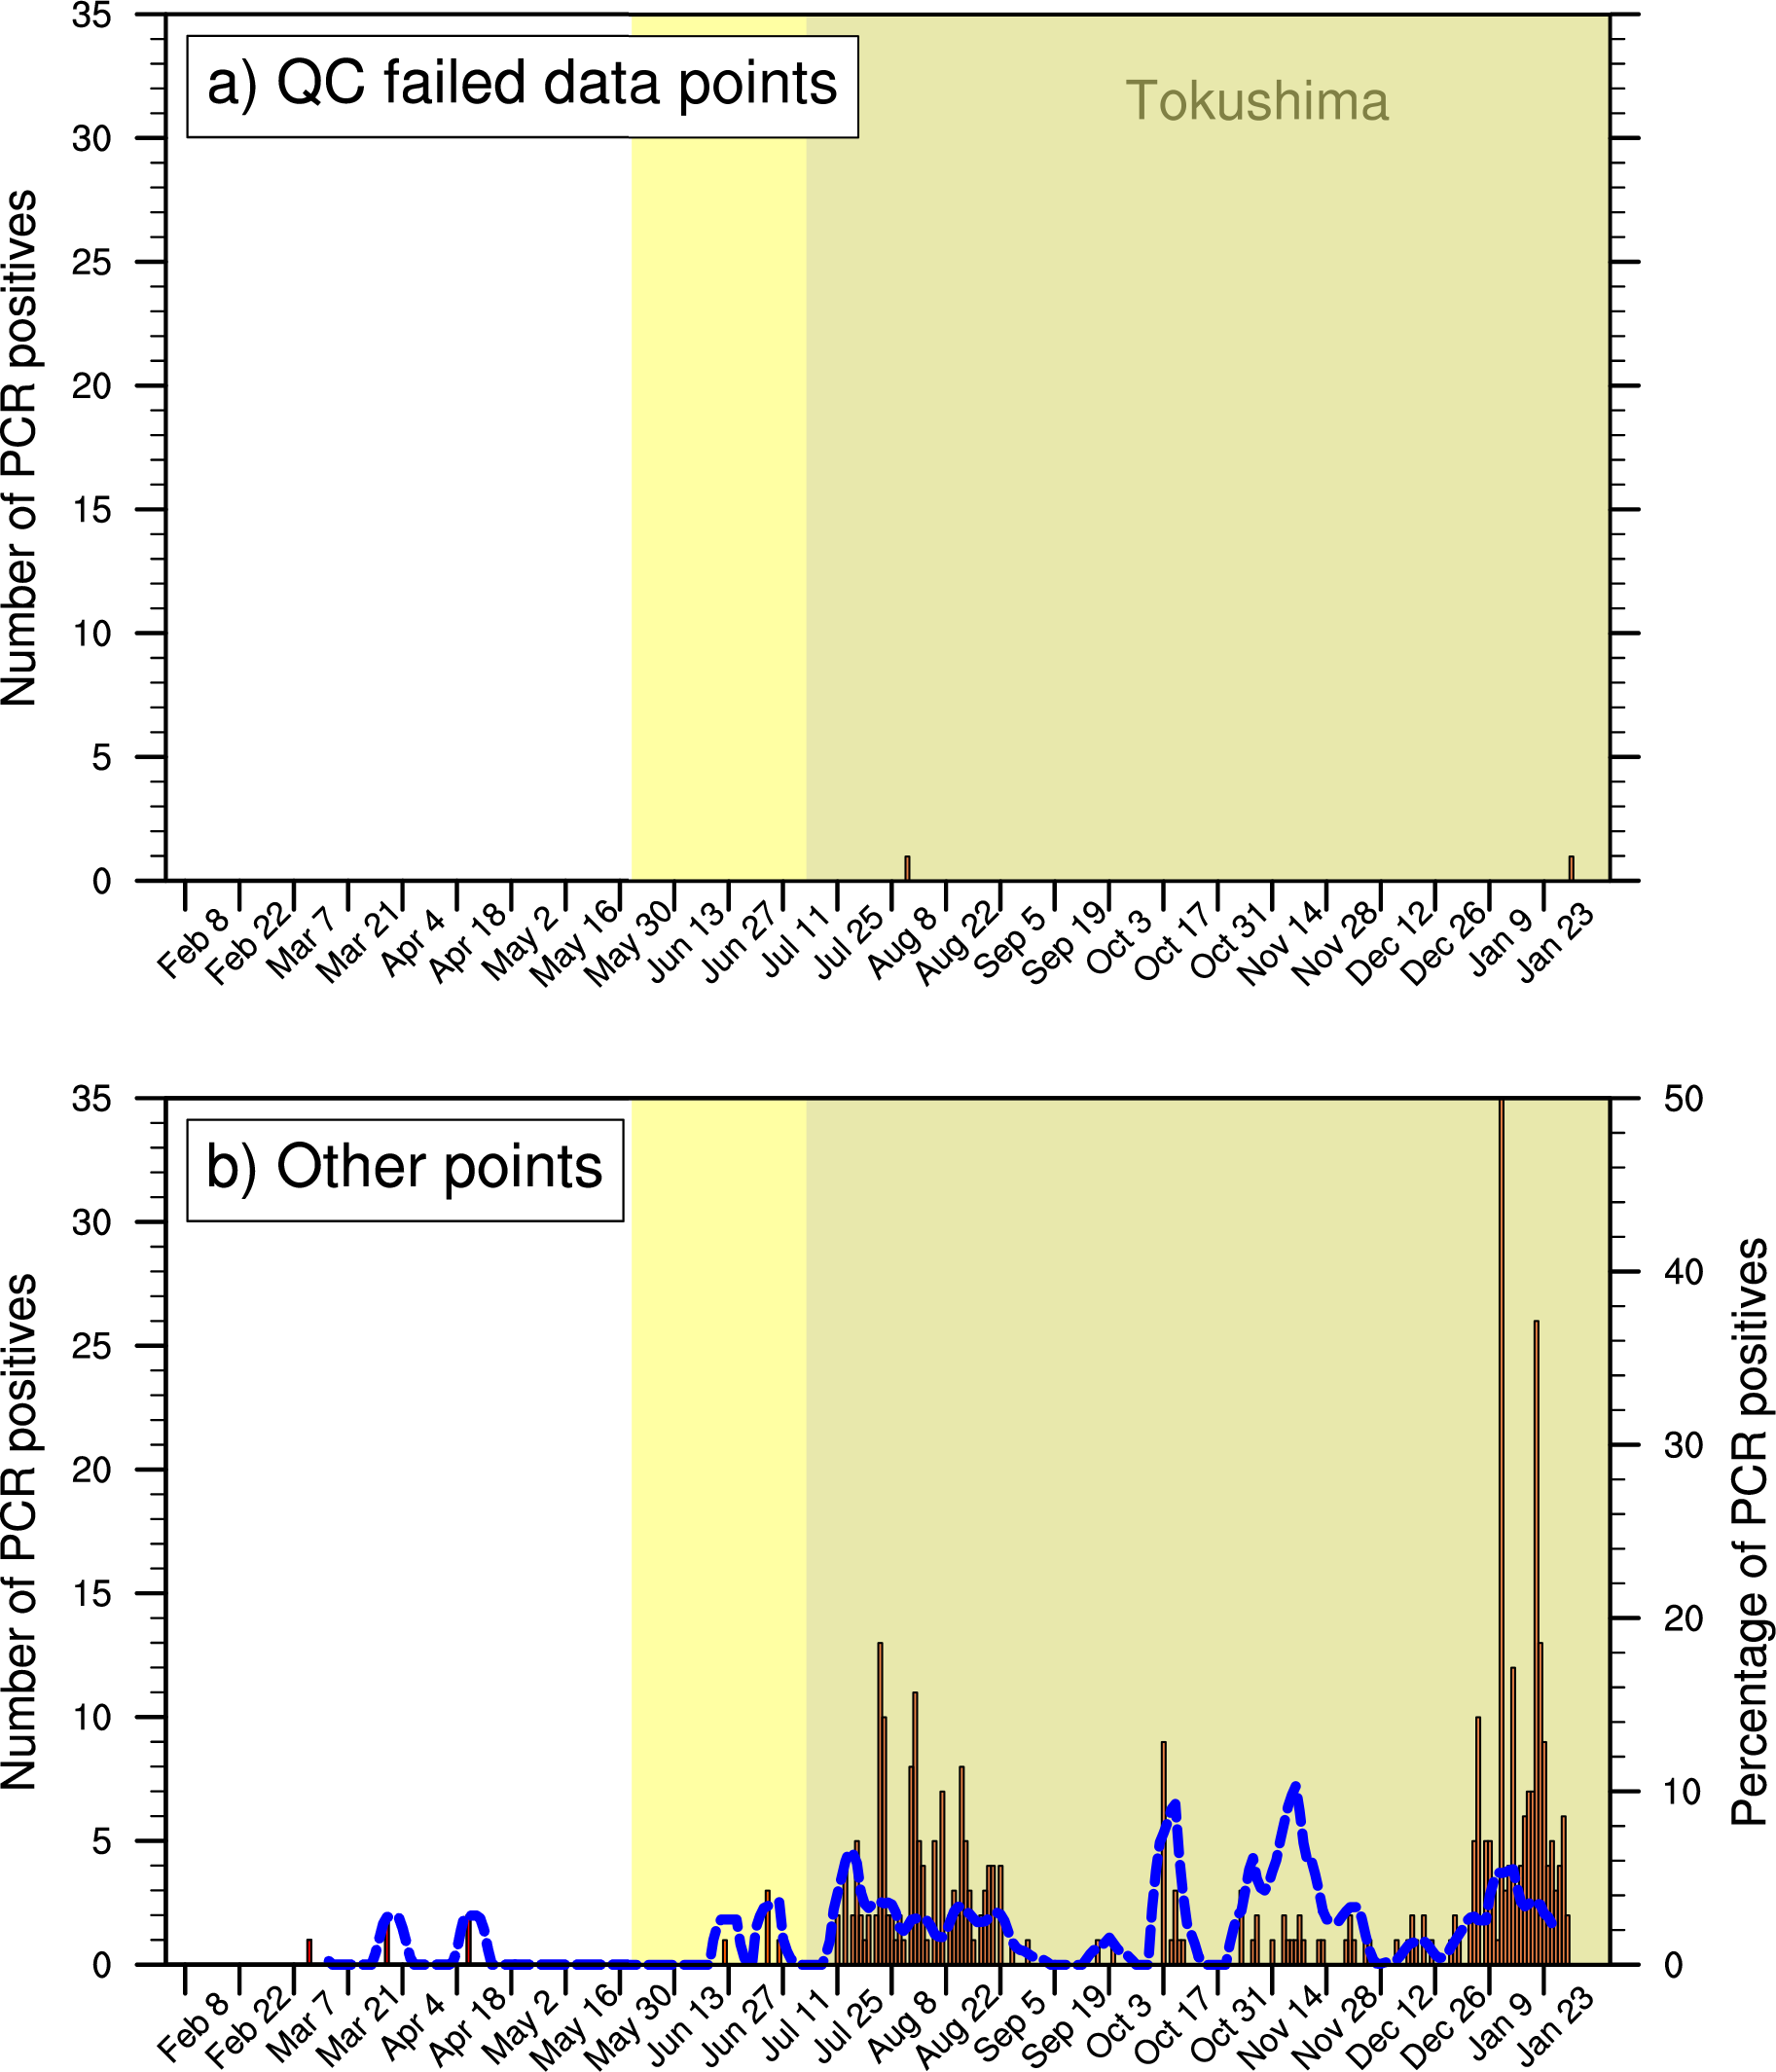
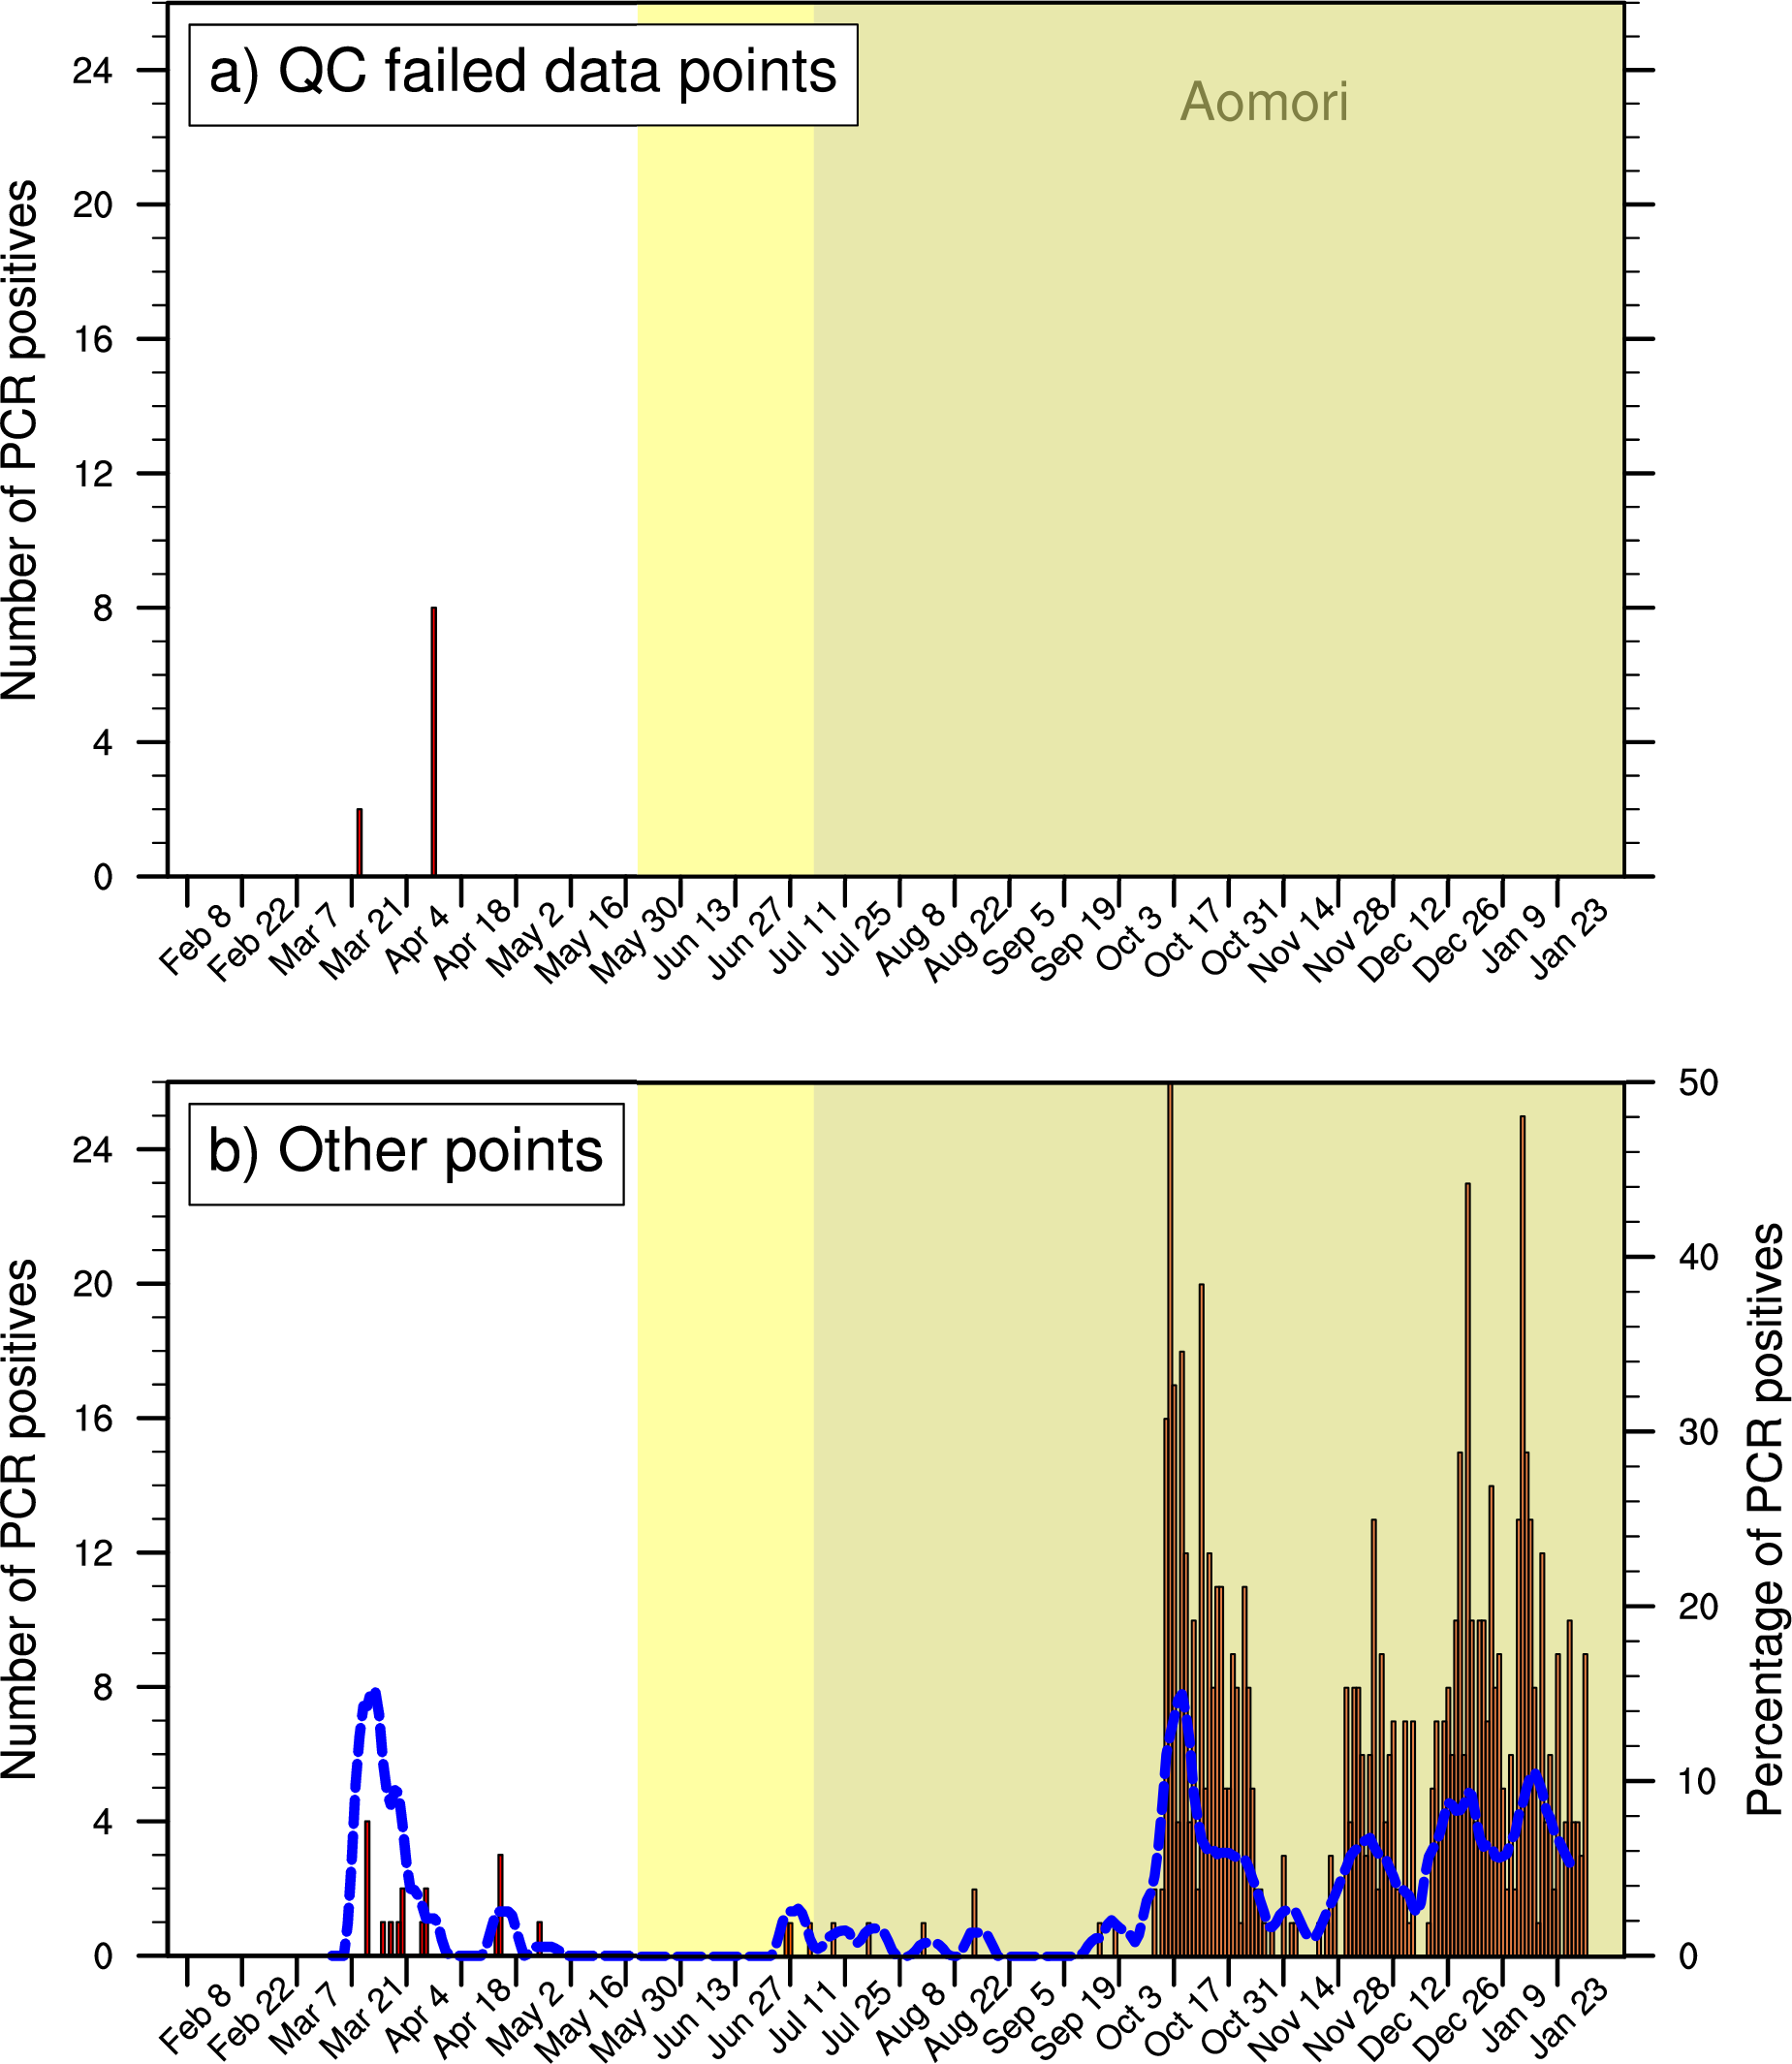
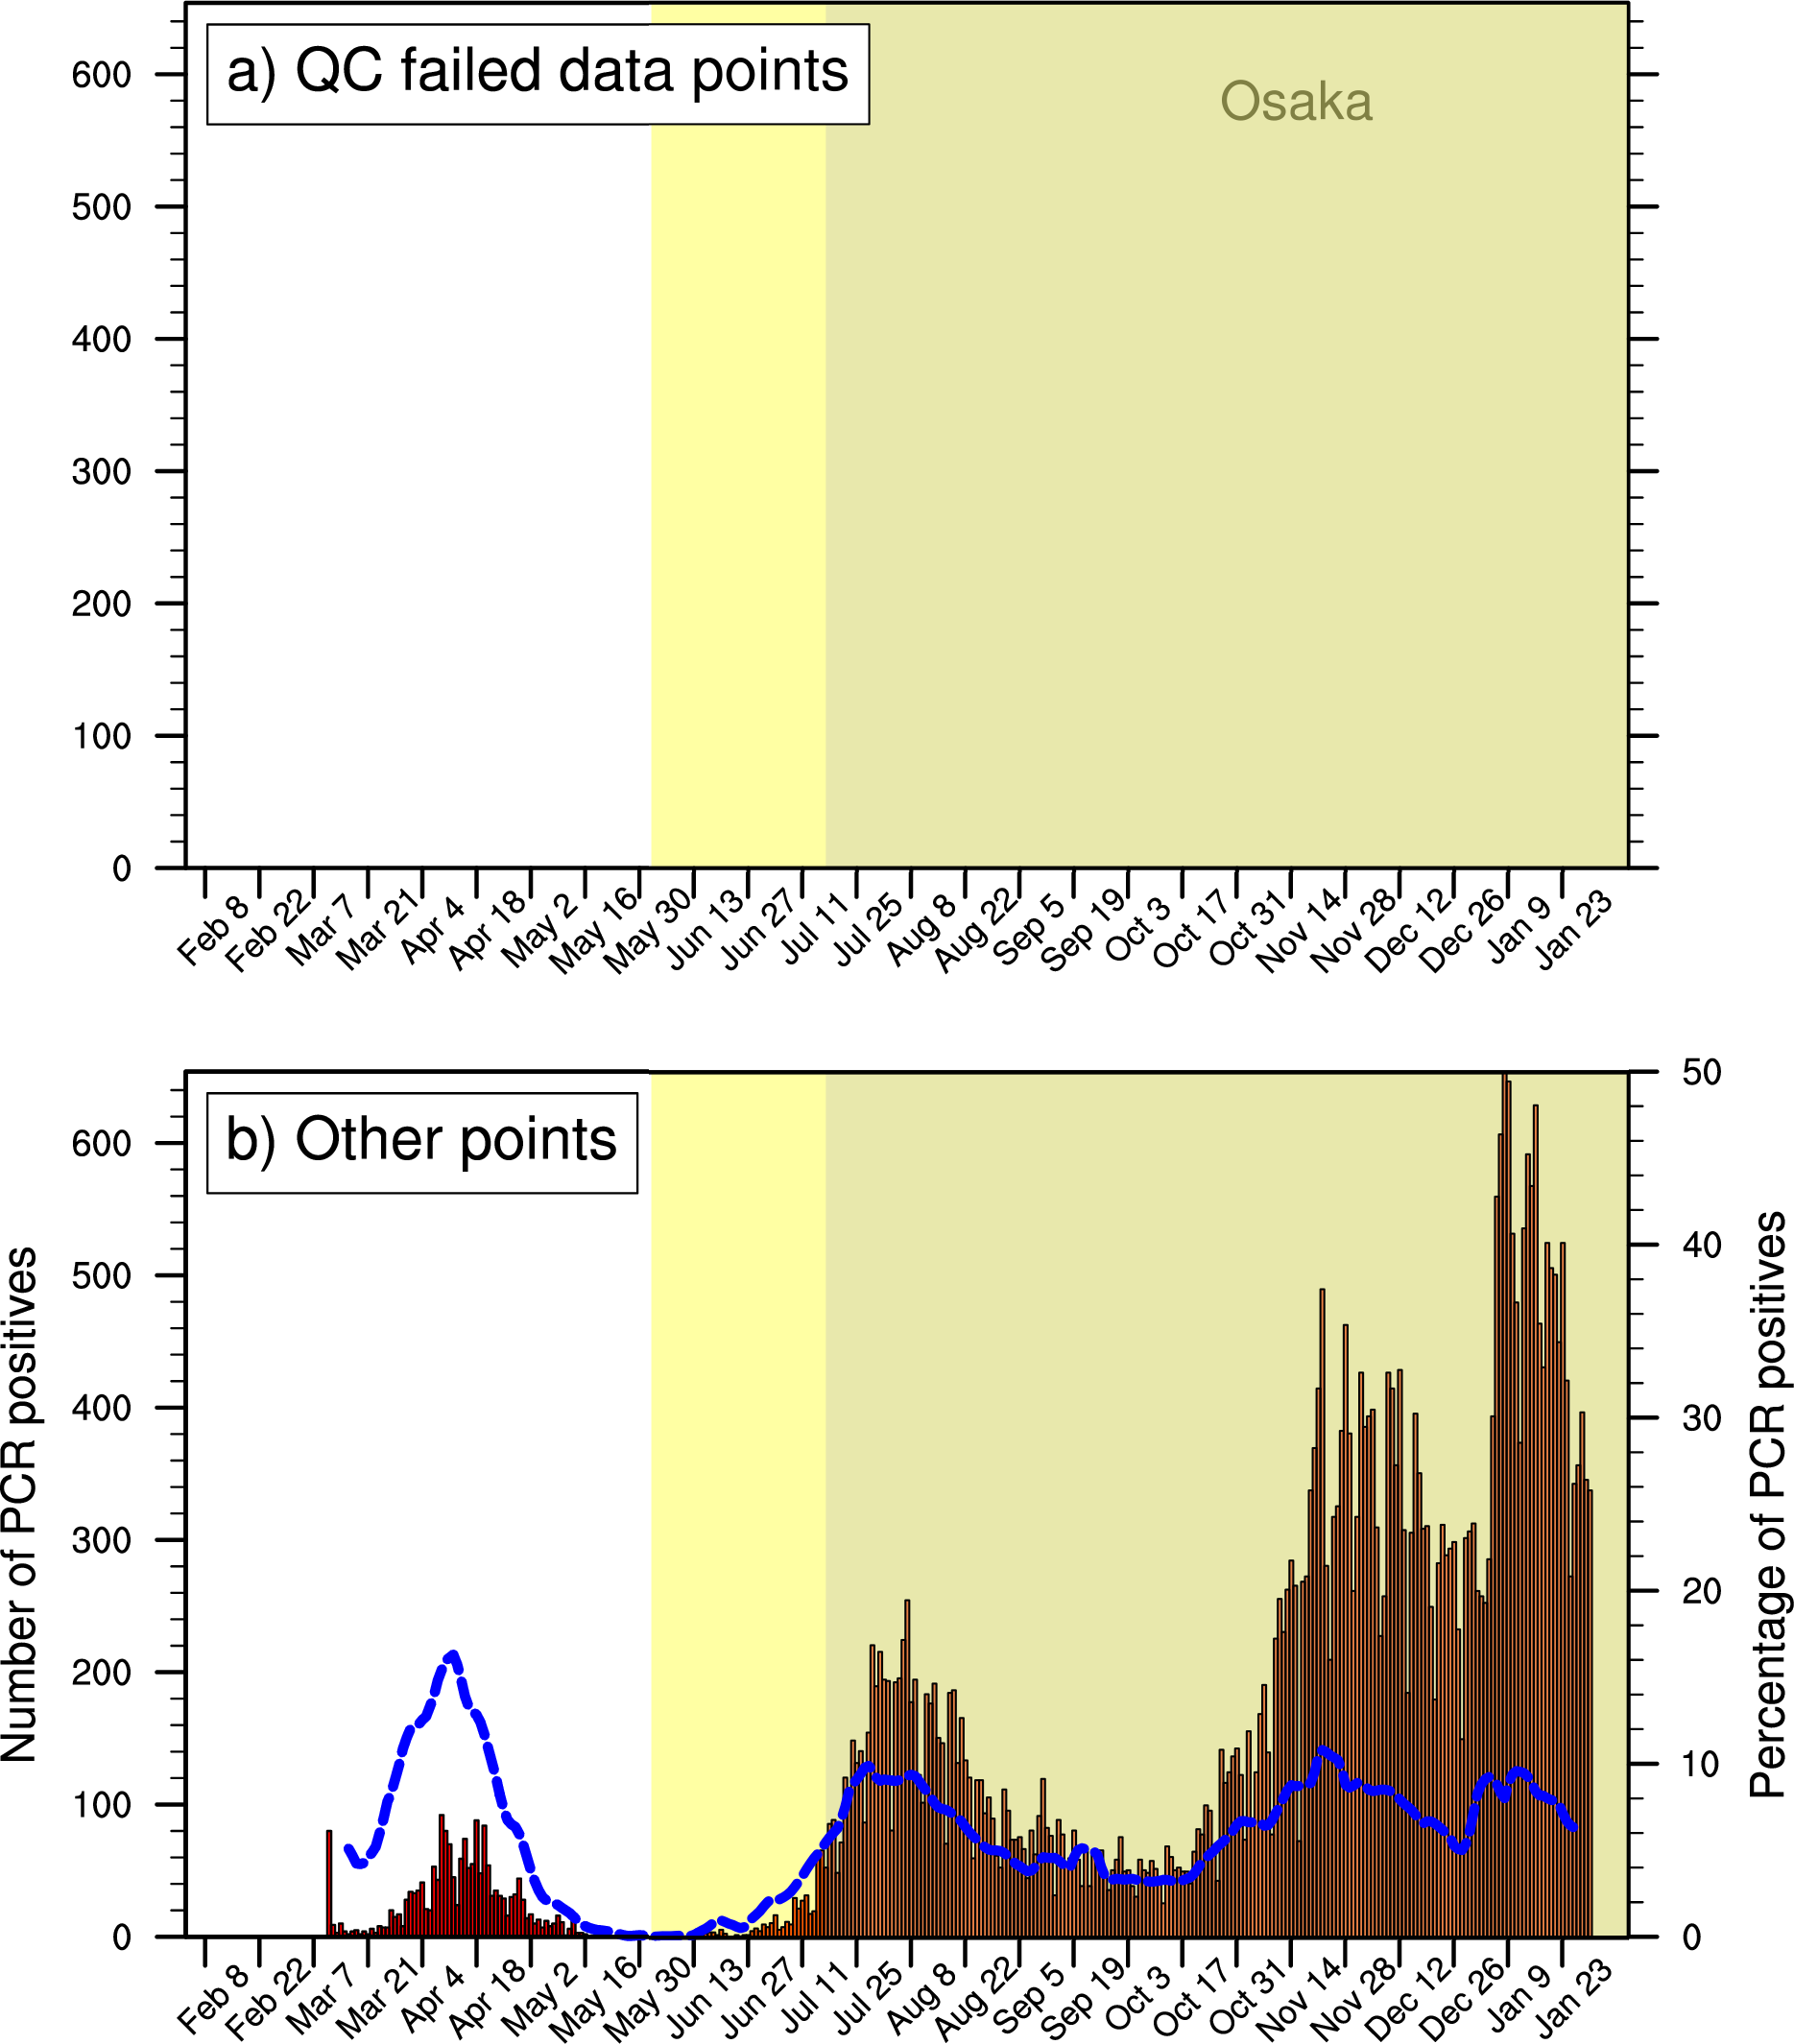
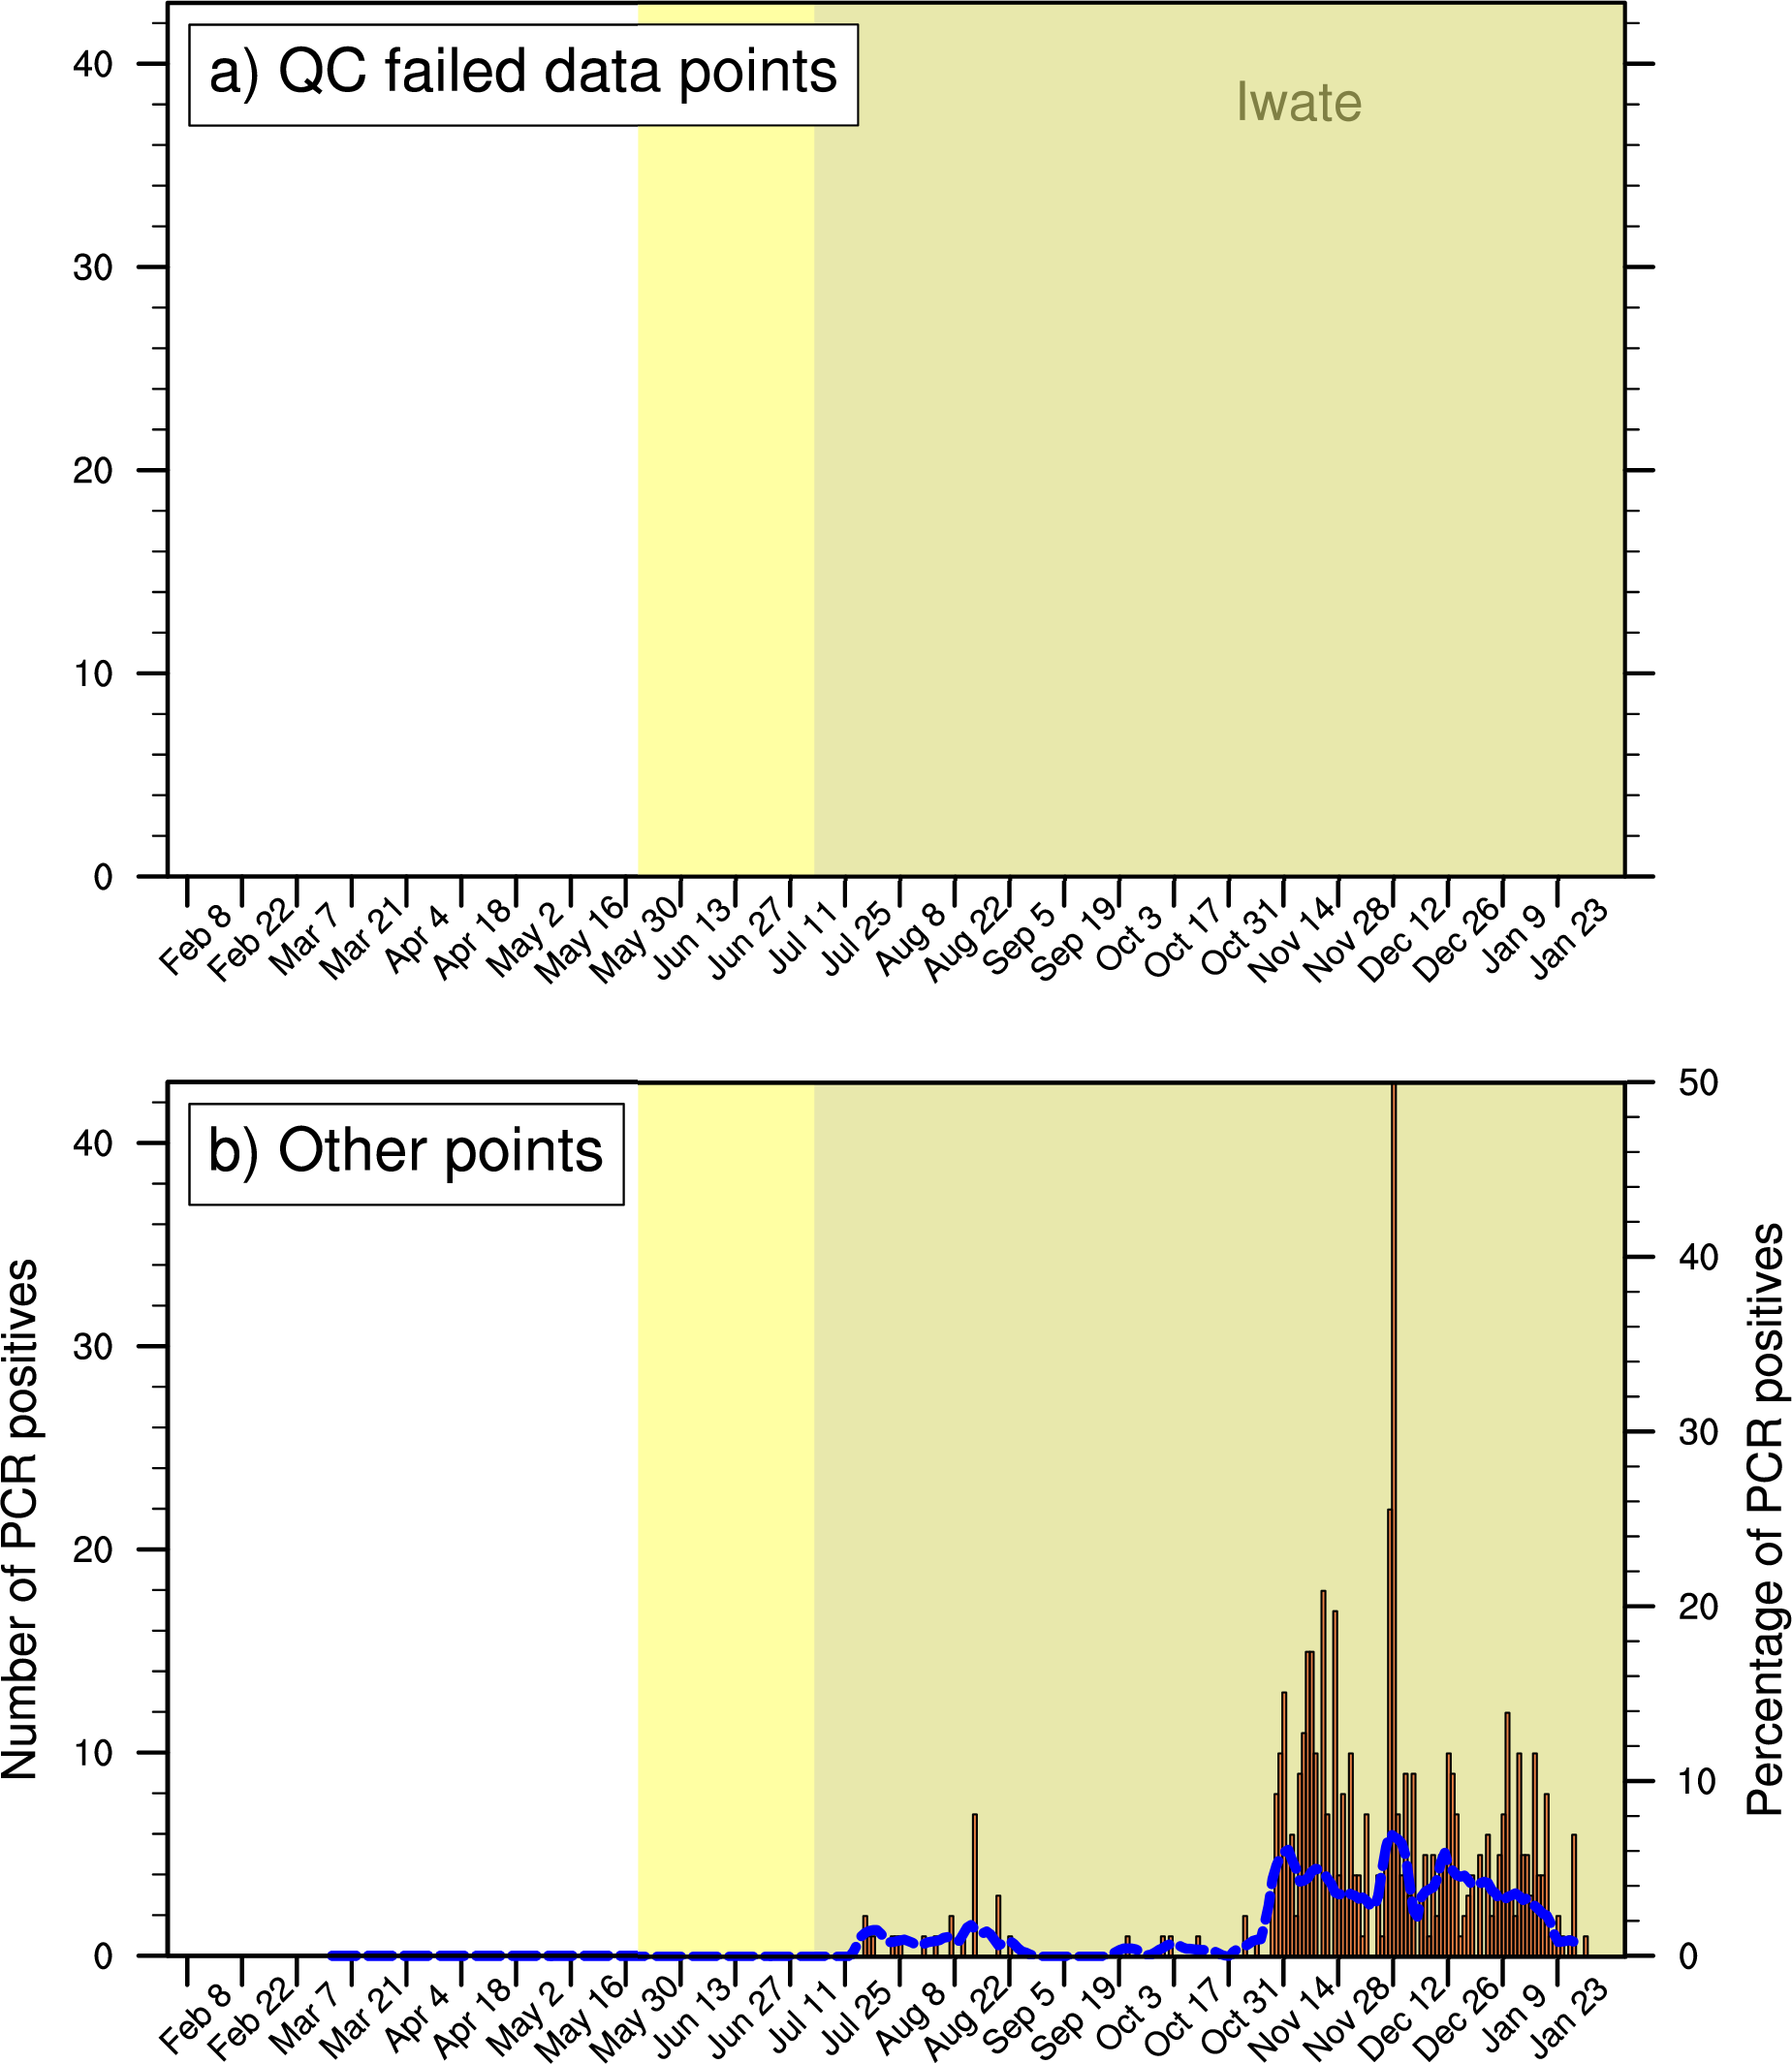
Please click on the prefecture to open a plot which shows the dates at which these suspicious data points are found (top figure).
- the bottom figure on the plot shows the daily positive PCR counts as the vertical bars. The thick line is the percentage of positive PCR counts relative to the total tests.
- the background shading on the plots show periods where testing policy has changed. Initially, the PCR tests were carried out on swabs of nasal and throat mucus in symptomatic people (fever above 37.5 C sustained for 3 days or more).
- The yellow region shows the period when this policy was changed to PCR testing on saliva from symptomatic people.
- Then on July 17 (grey shade), the PCR tests could be done from saliva swabs on anyone (asymptomatic or symptomatic).
| Prefecture | No of PCR positives | No of PCR tests | Percentage of bad points |
|---|---|---|---|
| Okayama | 1907 | 0 | 31.0 |
| Nara | 1278 | -4404 | 30.4 |
| Mie | 1474 | 0 | 26.8 |
| Hiroshima | 2896 | 0 | 25.1 |
| Ibaraki | 1949 | 138 | 24.9 |
| Yamaguchi | 908 | 0 | 20.9 |
| Aichi | 9799 | 0 | 20.9 |
| Kanagawa | 1533 | 29 | 20.4 |
| Toyama | 298 | -468 | 15.1 |
| Nagano | 732 | 1 | 13.7 |
| Shimane | 102 | 0 | 12.6 |
| Akita | 142 | 11 | 12.3 |
| Okinawa | 1238 | -10127 | 10.9 |
| Shizuoka | 1320 | -11618 | 9.8 |
| Gunma | 932 | 8 | 9.8 |
| Miyazaki | 413 | 7 | 8.4 |
| Chiba | 856 | 90 | 6.7 |
| Ishikawa | 143 | 0 | 6.4 |
| Shiga | 111 | 9 | 6.1 |
| Kagoshima | 227 | 0 | 5.9 |
| Yamanashi | 241 | 0 | 5.9 |
| Saitama | 2481 | 241 | 5.9 |
| Kumamoto | 433 | 0 | 4.7 |
| Kyoto | 101 | 2 | 4.5 |
| Miyagi | 304 | 0 | 4.5 |
| Fukuoka | 855 | 50 | 4.2 |
| Niigata | 58 | -134 | 3.9 |
| Yamagata | 45 | 11 | 3.9 |
| Fukushima | 34 | 1 | 3.6 |
| Fukui | 43 | 10 | 3.1 |
| Tokyo | 1373 | 276 | 2.8 |
| Kochi | 54 | -453 | 2.5 |
| Tochigi | 32 | -380 | 2.5 |
| Gifu | 32 | 6 | 2.2 |
| Nagasaki | 23 | 1 | 2.0 |
| Wakayama | 22 | 3 | 2.0 |
| Saga | 11 | 0 | 1.7 |
| Ehime | 8 | 0 | 1.4 |
| Kagawa | 8 | 0 | 1.4 |
| Oita | 12 | 0 | 1.1 |
| Tottori | 6 | 0 | 1.1 |
| Tokushima | 2 | -148 | 0.6 |
| Aomori | 10 | 0 | 0.6 |
| Hyogo | 0 | 0 | 0.0 |
| Osaka | 0 | 0 | 0.0 |
| Iwate | 0 | 0 | 0.0 |
| Hokkaido | 0 | 0 | 0.0 |