Questions and comments may be addressed to Saji N. Hameed by email (saji'at-mark'u-aizu.ac.jp) or from my ResearchGate page
Disaster Preparedness -- lessons from the people of Japan
Japan is known for its high technology. While these certainly help in monitoring and in communicating warnings on impending natural disasters, the main distinguishing characteristic of the Japanese people is their preparedness as individuals and as communities.
Below, a collection of videos highlight how the people of Japan cope with natural disasters. Hopefully, we can all learn from these and help keep our families, neighbours, and fellow citizens safe and healthy during natural disasters...
Continue reading ....
A monster of an IOD
The strength of this IOD is enormous. We were anticipating it to exceed the 2006 event, based on the DMI comparisons at http://enformtk.u-aizu.ac.jp/blog/2019/09/03/how-strong-is-the-2019-iod/
But, this seems destined to break some records. Look at the wind and OLR anomalies. They are well matched with SST anomalies and will further cool the SST at the eastern Indian Ocean, pushing the IOD to greater strength by the end of October. Perhaps, this IOD is similar to the 1961 event as my good friend...
Continue reading ....
How did past IOD events impact Equatorial East Africa?
Reports on flood related issues during the 2006 IOD
An early report on 2006 E. African floods by P. Moszynski in BMJ (Sep 2006)
UNICEF reports on E. African floods during Nov of 2006
IFRC reports on E. African floods during 2006--2007
Scientific articles on relation between IOD and E. African rains
Dipole: the Indian Nino that has brought devastating drought to East Africa
The relationship between Indian Ocean sea–surface temperature and East African rainfall
Continue reading ....
How will IOD impact Equatorial East Africa?
It is easy to answer what the impacts of IOD are on equatorial East Africa. However, the question as to when and how different areas within this large region will be affected is difficult to answer.
From the characteristics of a positive IOD event, we can see that large areas of equatorial East Africa will experience heavier than usual rainfall during the last three months of the year. This happens as warm SST anomalies developing over the central Indian Ocean expand and reach the seas near the...
Continue reading ....
The tale of a buoy standing steady.
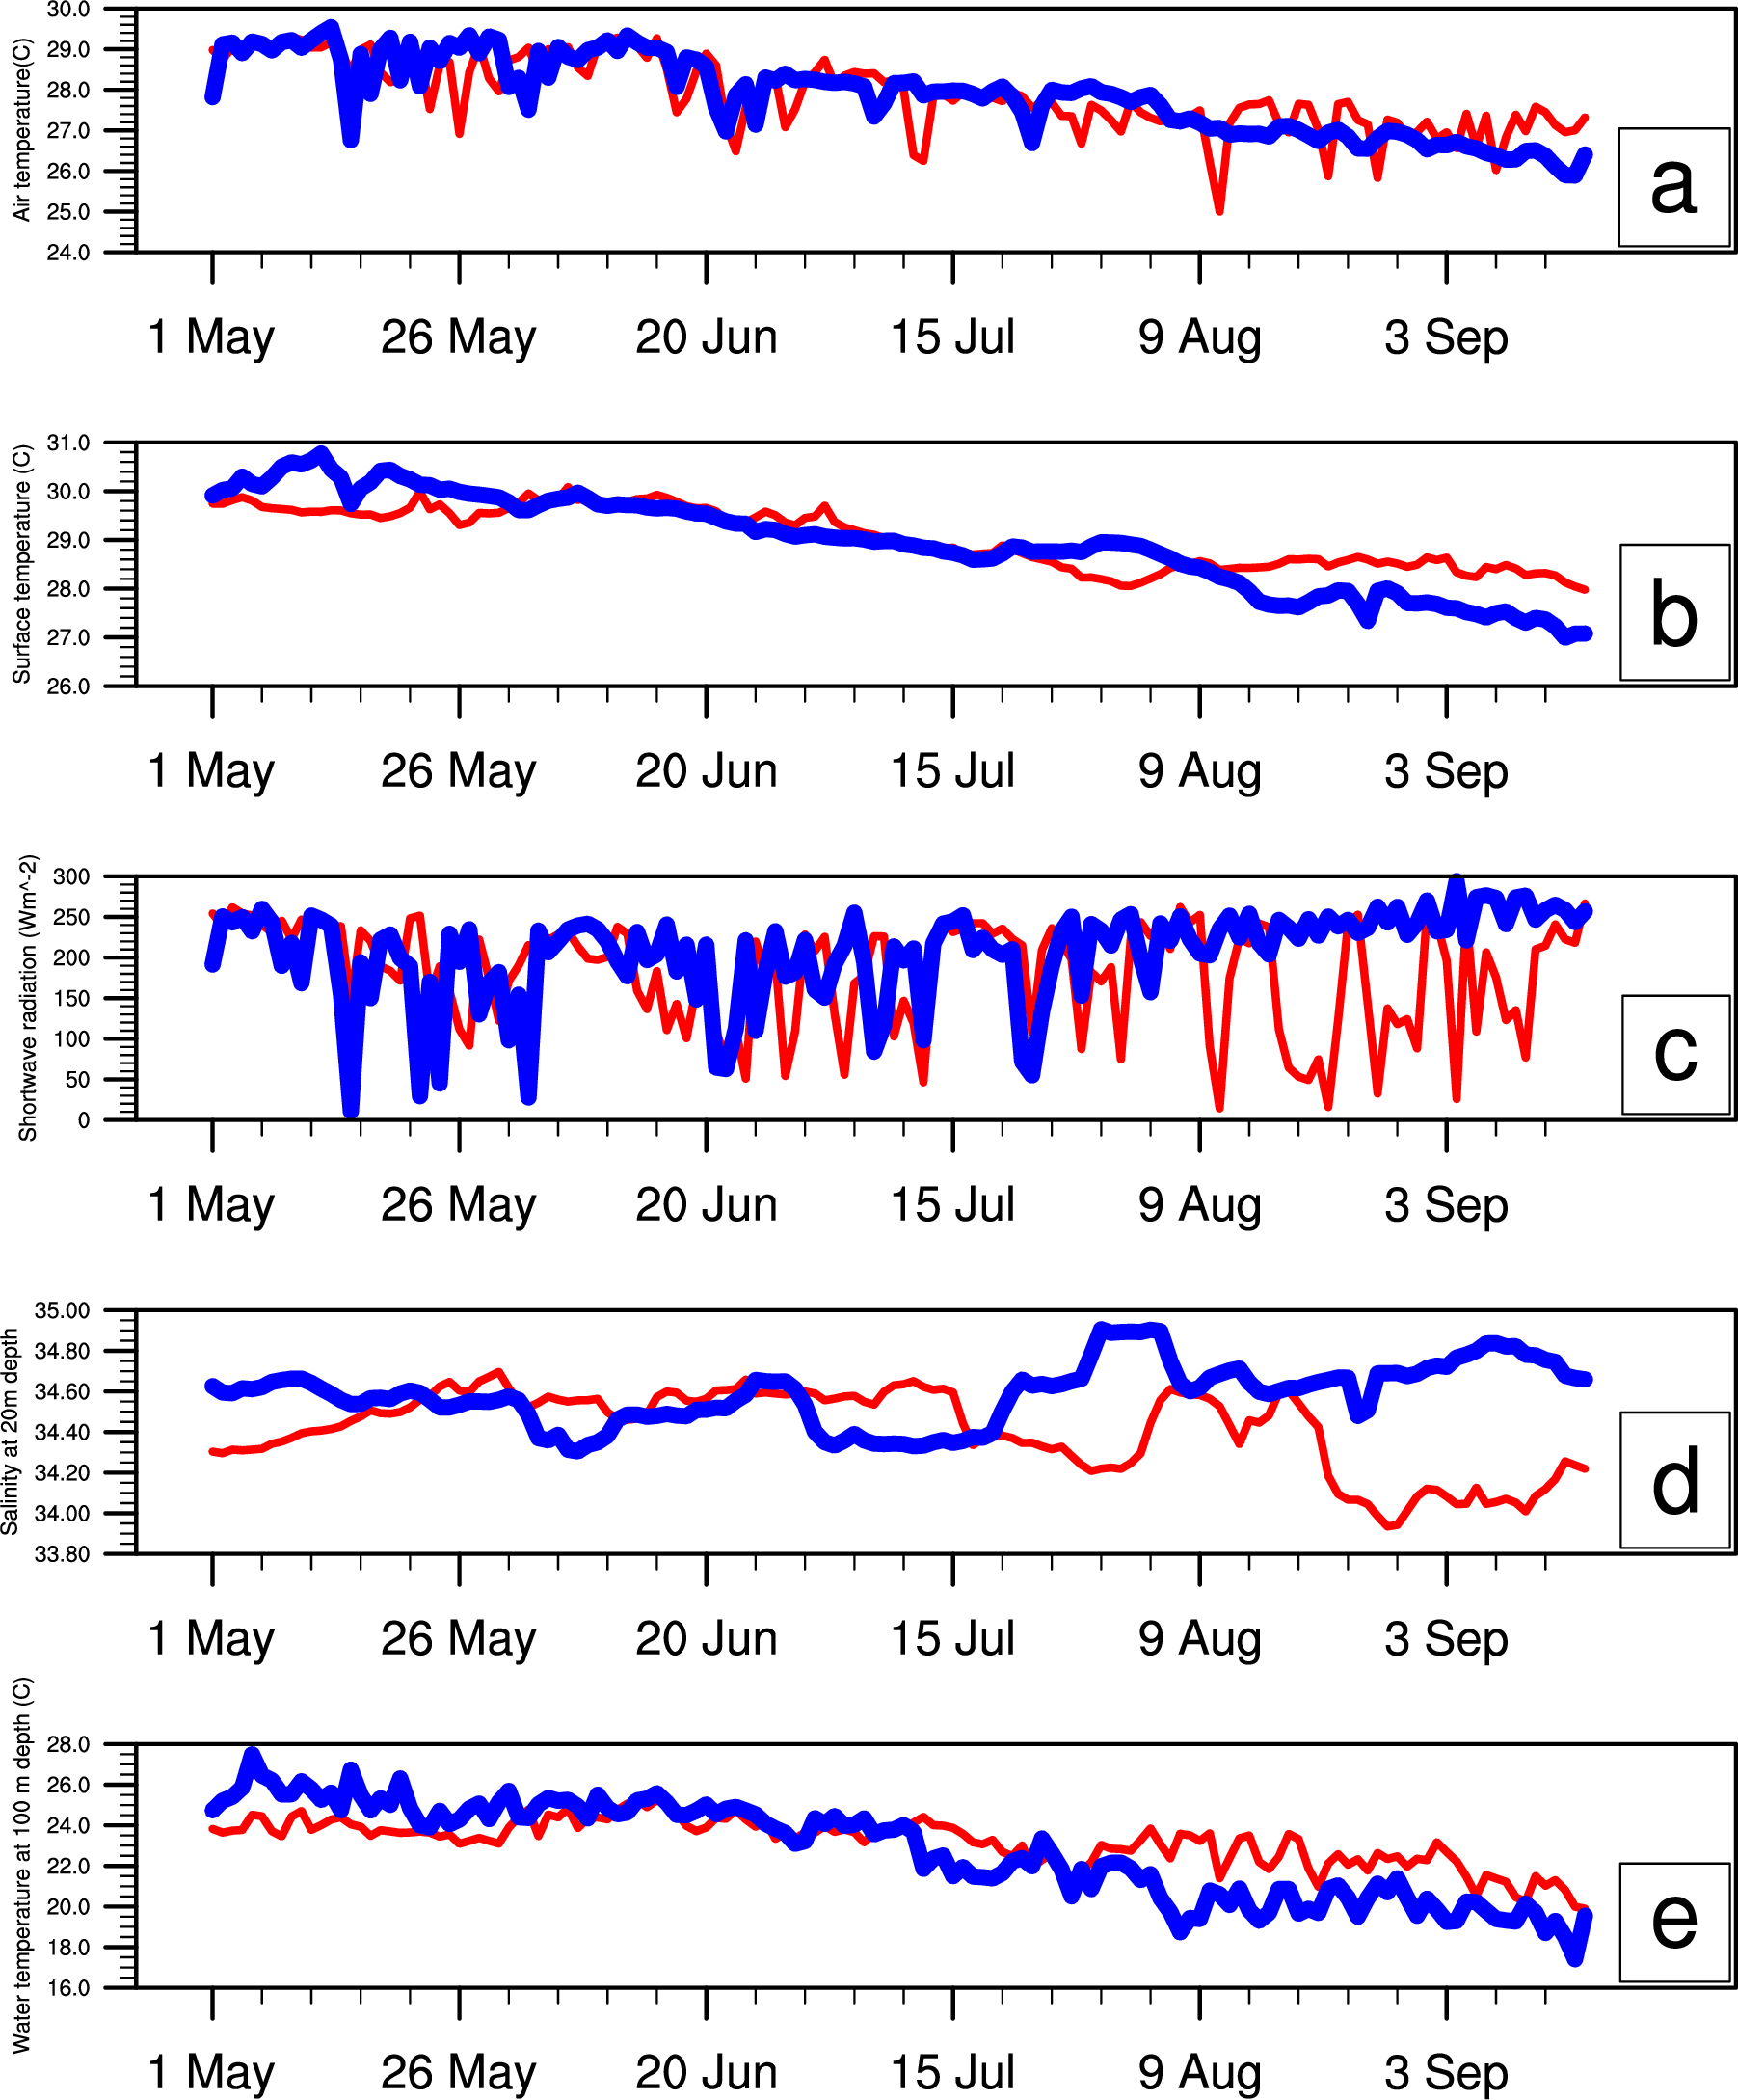
Plots of daily mean (a) Air Temperature, (b) Surface water temperature, (c) Shortwave radiation, (d) Salinity at 20 m depth, and (e) Water temperature at 100m depth. The blue line is for 2019, and the red line is for the year before that (2018).
The data is from a bouy deployed by JAMSTEC at 5 South latitude, and 95 E longitude (in plain words, just to the west of Sumatra island)
Do you see what I see? Or, am I imagining things?Continue reading ....
Where else can you find information about the ongoing IOD?
National Center for Environmental Prediction (NCEP), USA
Indian Ocean SST indices based on GODAS and SST products
Monthly DMI based on GODAS for the past 4 years
Monthly DMI based on GODAS since 1982
Weekly DMI based on GODAS since 1950
Monthly DMI based on GODAS over the last 10 years
IOD forecasts
IOD predictions of the NCEP CFSv2 model - forecast plumes
IOD prediction of the NCEP CFSv2 model - forecast plumes starting from different initial...
Continue reading ....
How strong is the 2019 IOD?
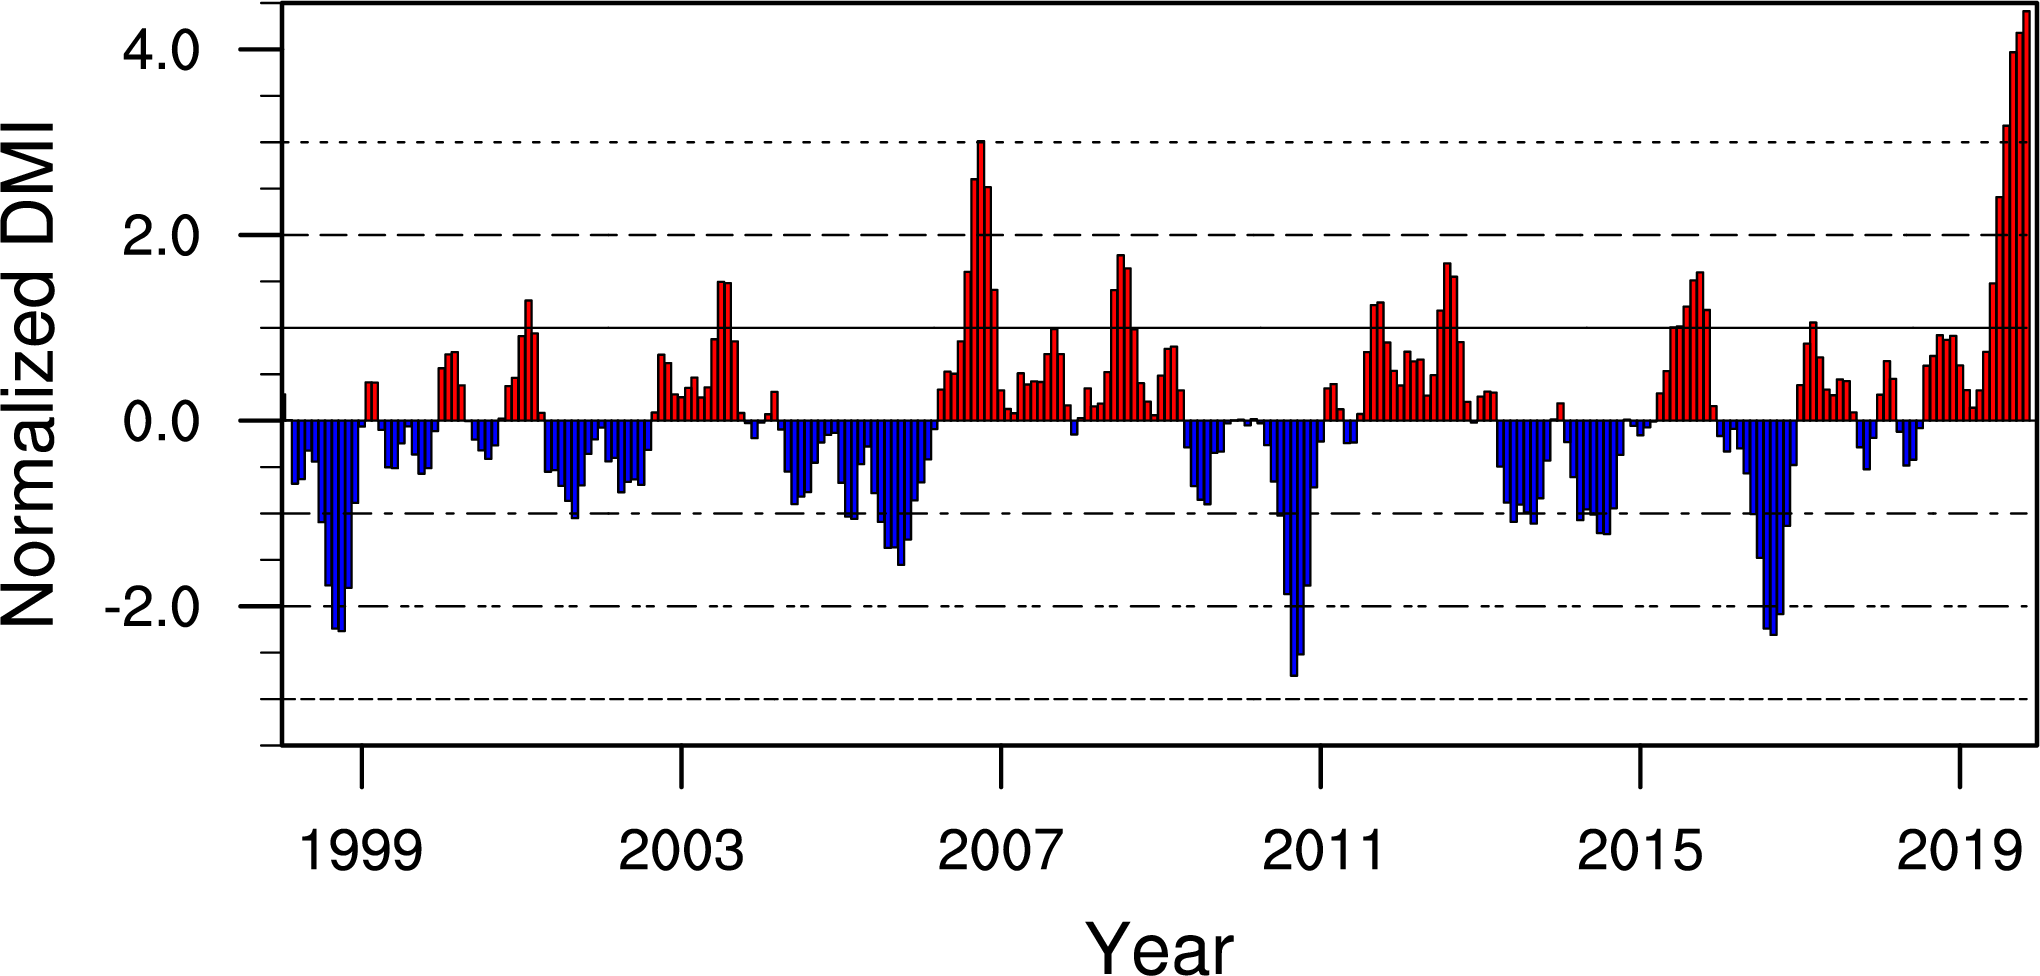
A plot of monthly DMI from Jan 1998 to Aug 2019. The strongest event prior to 2019 in this plot is 2006.
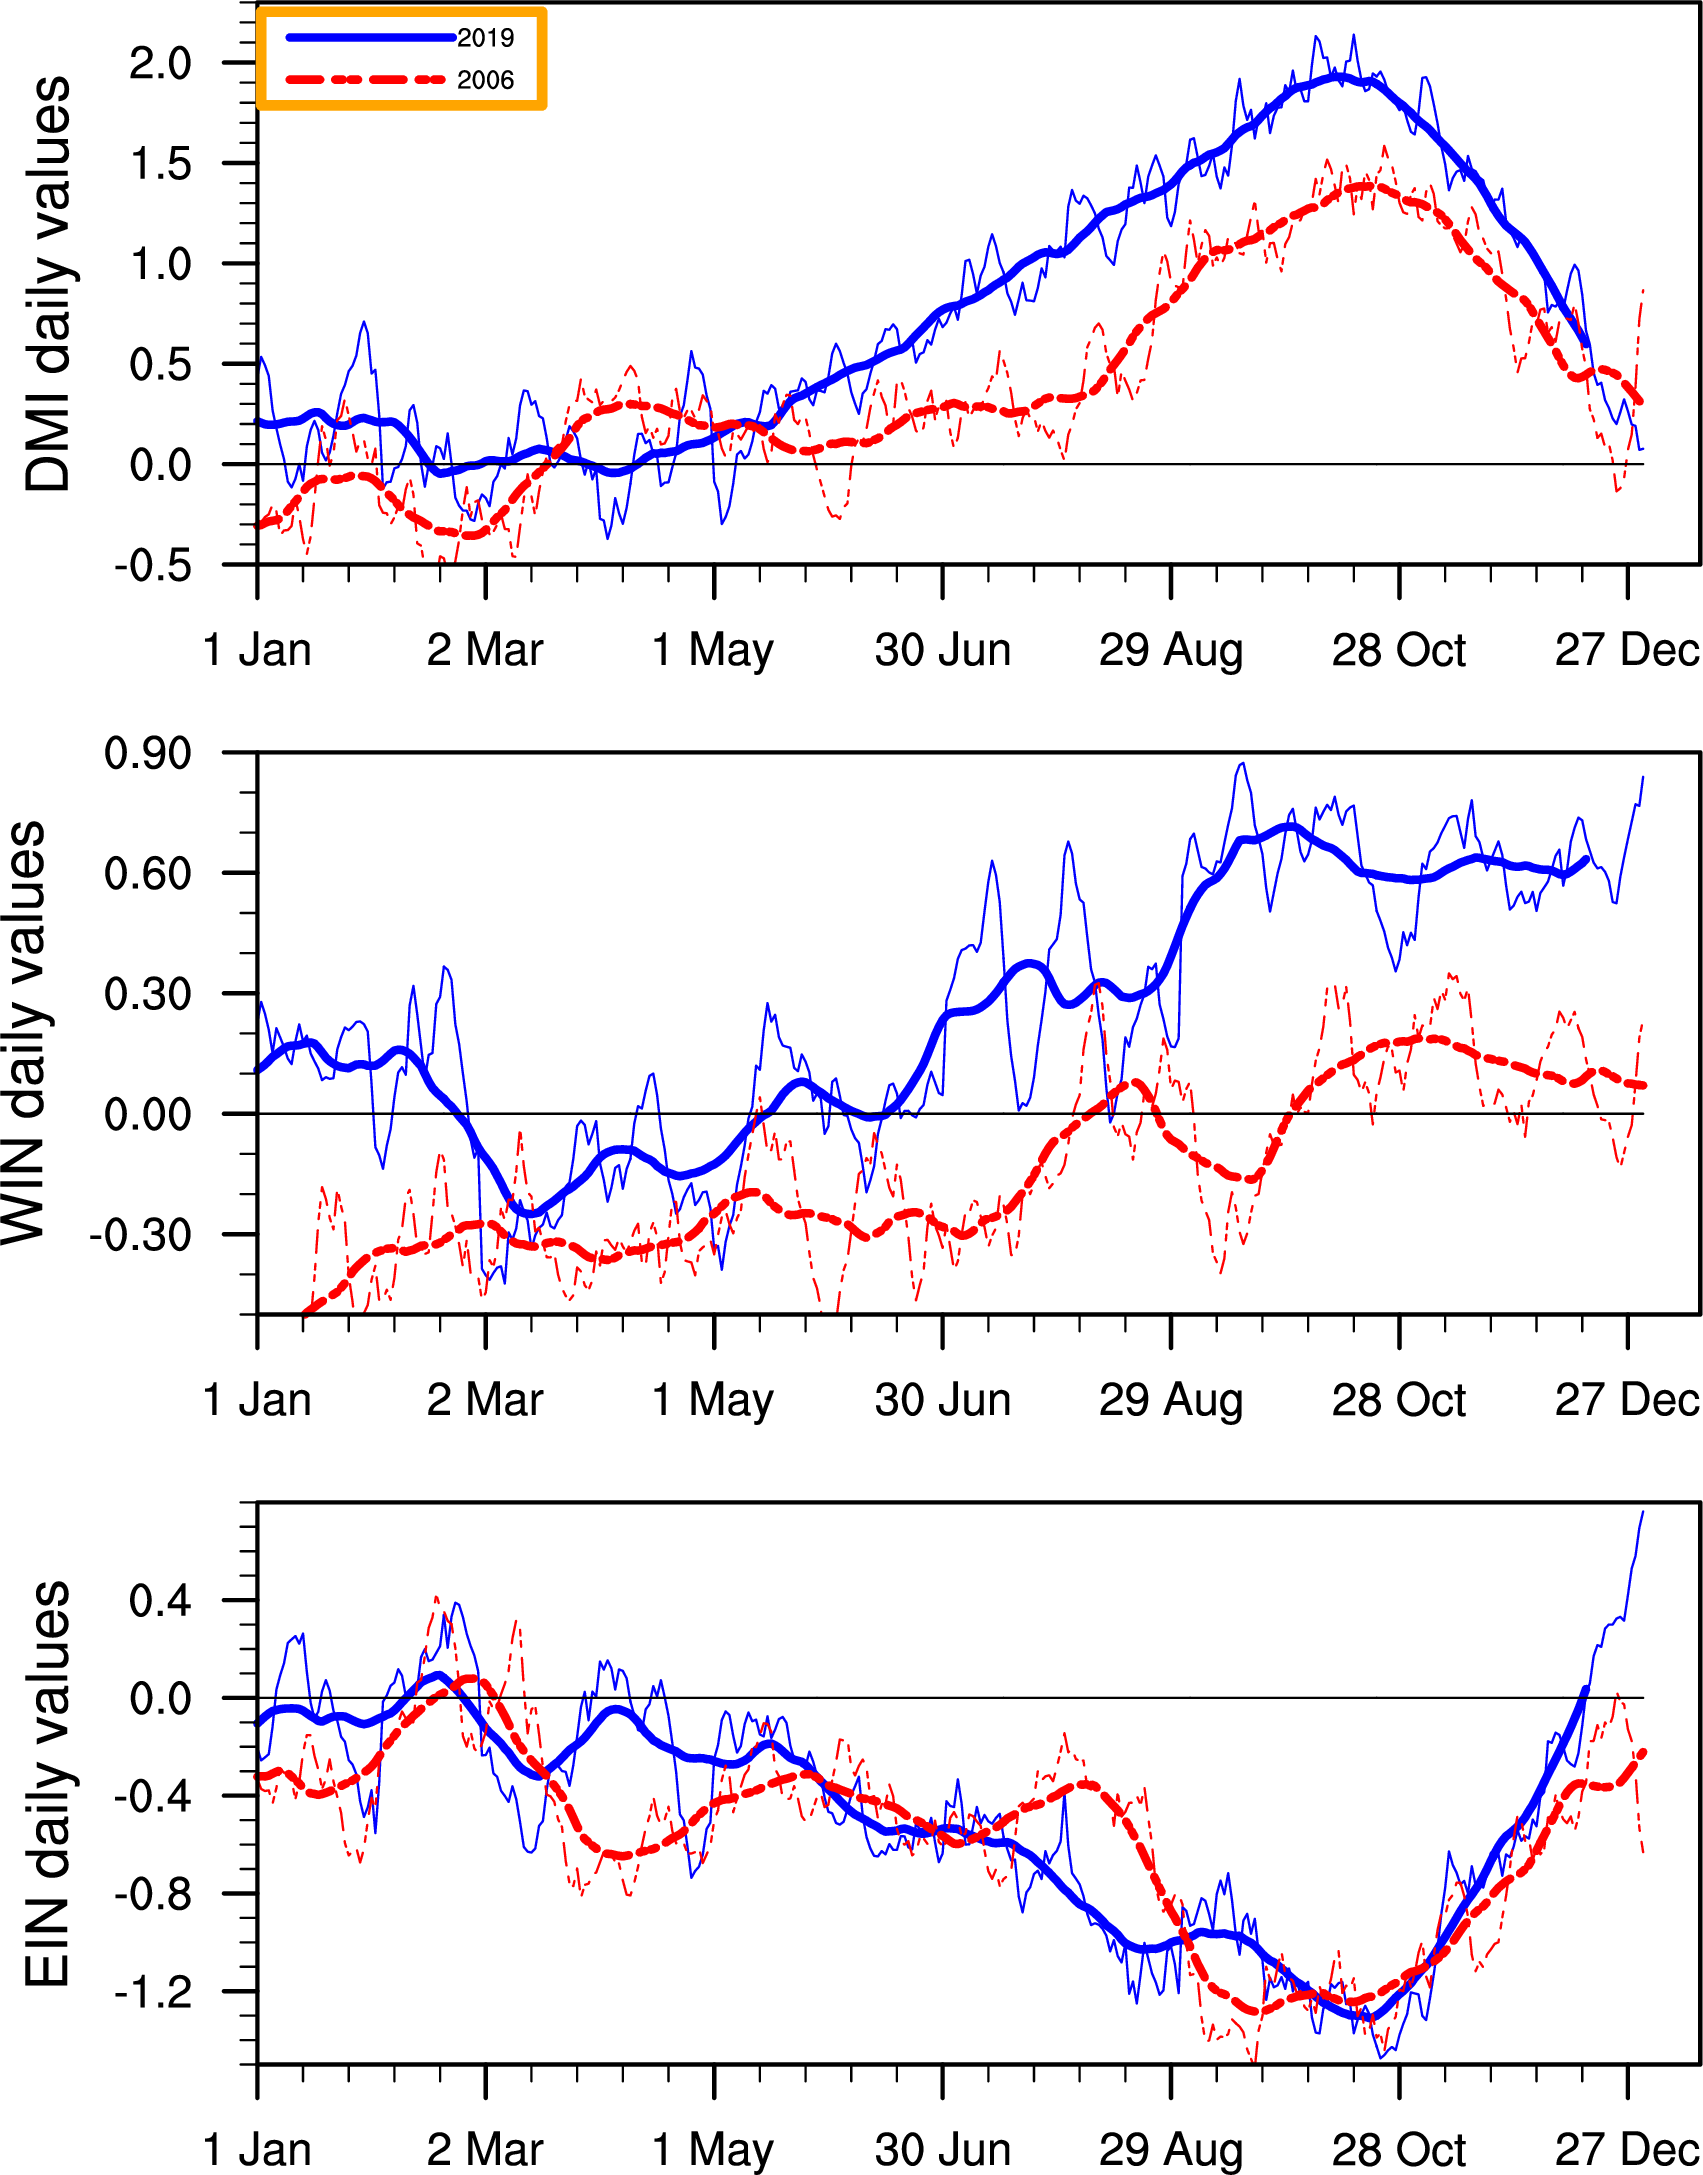
A plot of daily DMI, WIN, and EIN from 01 Jan 2006 to 31 Aug 2019 is compared to the same quantities during 2006 (For this plot, I have extended the quantities mentioned till 31Dec2006, so that you can see how the 2006 IOD evolved after August). The thicker lines show daily timeseries smoothed using a 91-day (3-month) running mean.
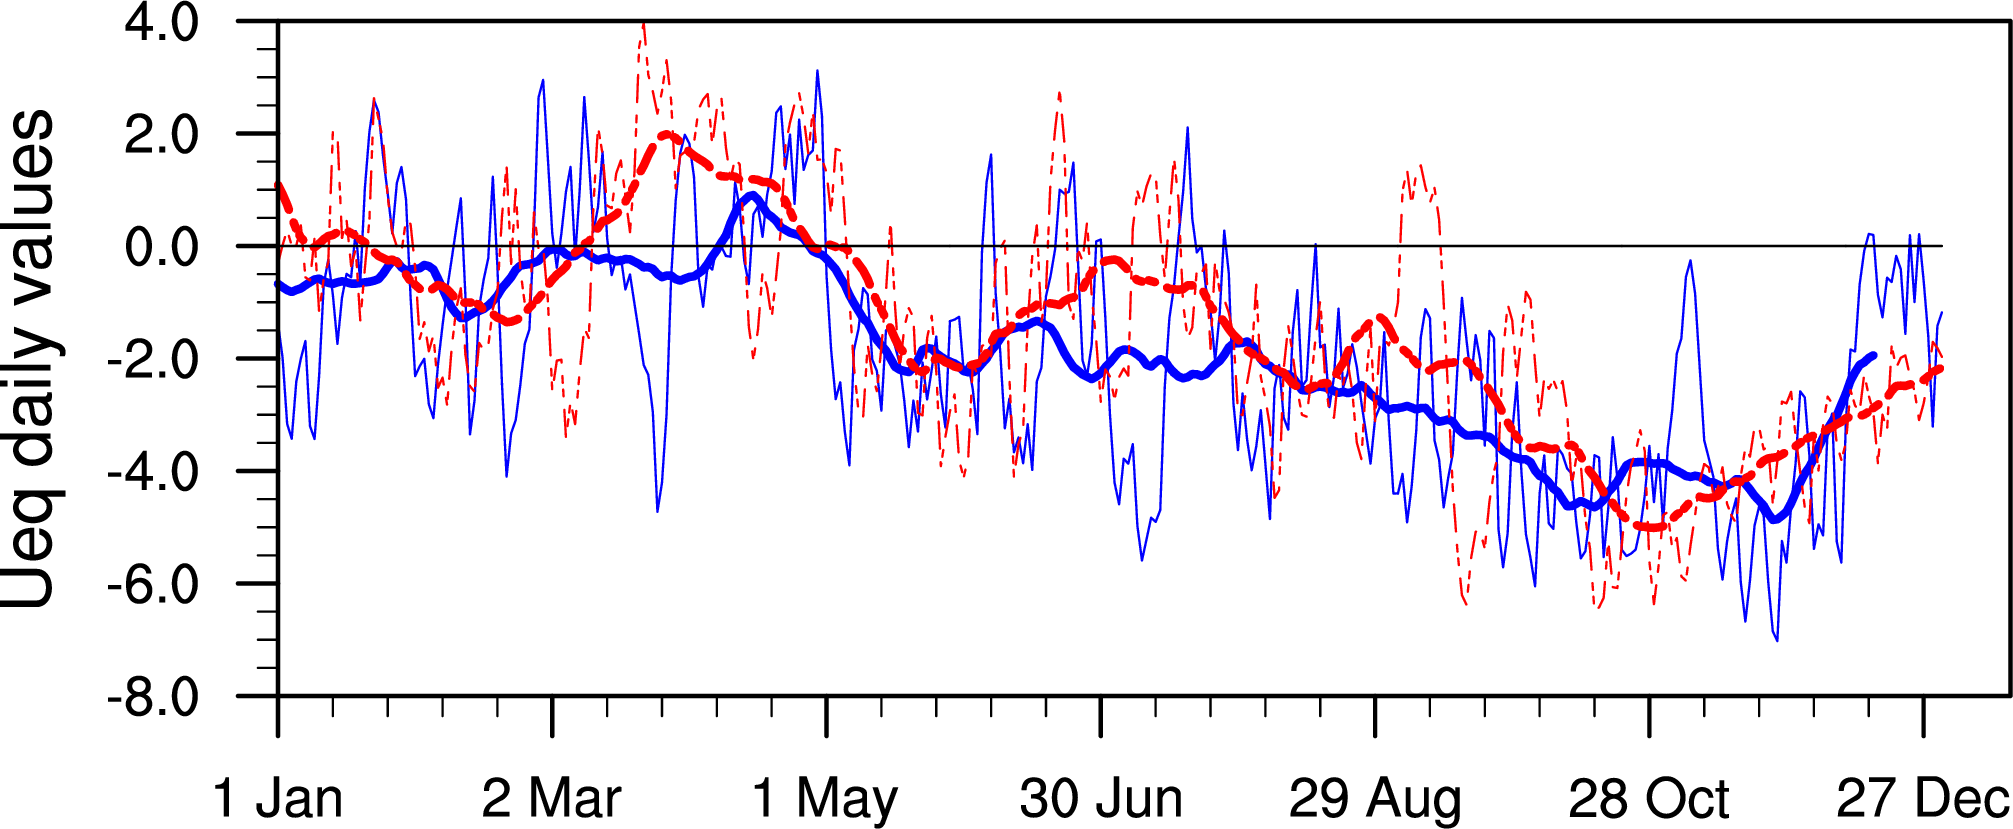 I will add my comments on these plots later....
Continue reading ....
IOD 2019 in the news
Tropical Africa
Indian Ocean Dipole spells flood danger for East Africa
Here’s the explanation for heavy rainfall currently pounding the country
Why the floods in East Africa are so bad
Floods kill 280 people, affect 2.8m others in EA: UN
Blogs on IOD
THE CLIMATE KELPIE BLOG: Indian Ocean in the climate ‘driver’s seat’ for 2019
Droughts over Australia -- current...
Continue reading ....
Soaring above the seas and into the clouds!
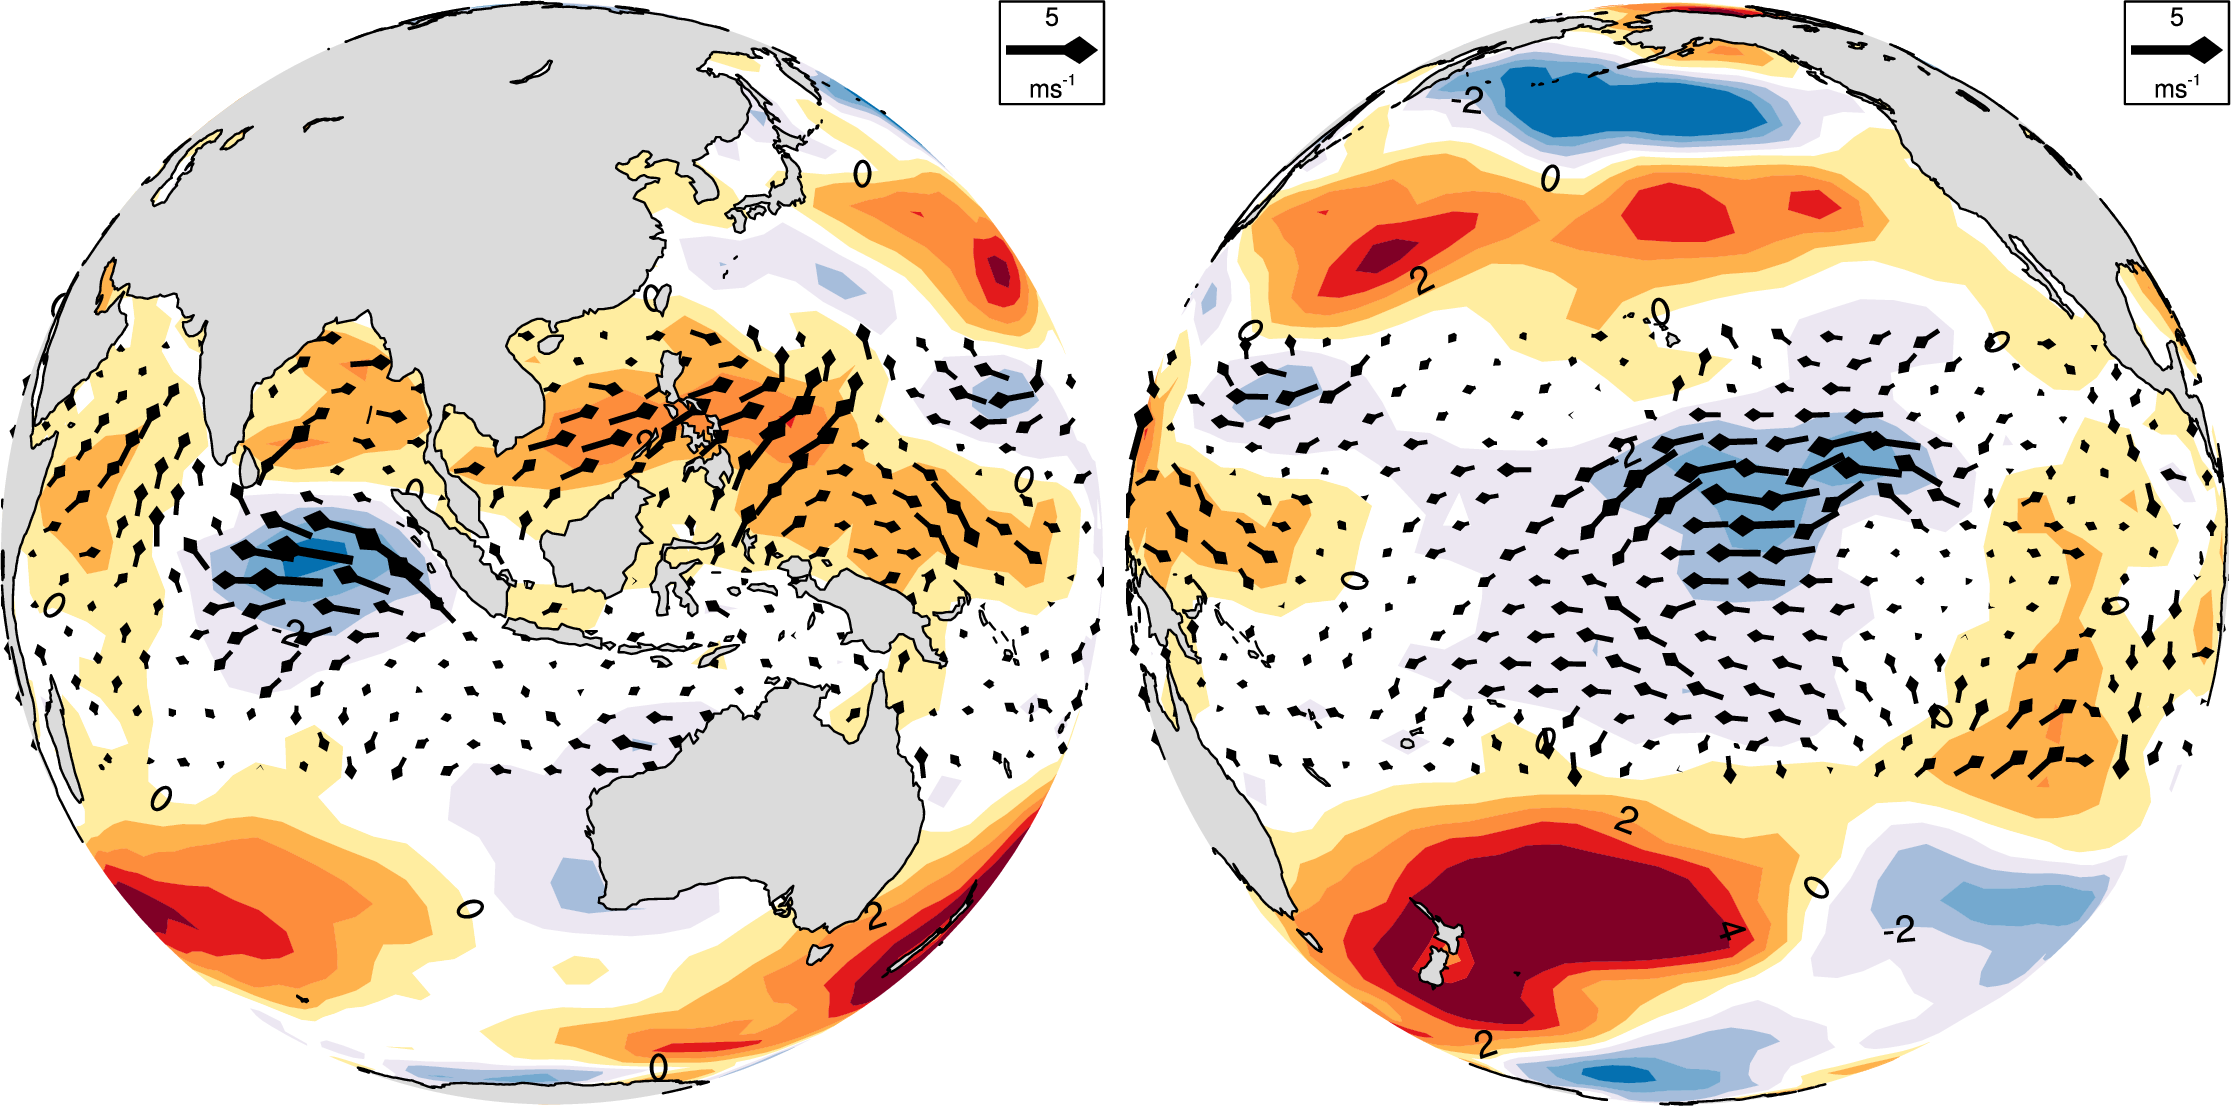
The wind anomalies at the surface of the tropical Indian ocean (left) and tropical Pacific ocean (right) are plotted as vectors in the figure above. The data used is from the NCEP reanalysis I (NCEPR1) project, and winds at the NCEPR1 model's sigma 0.995 level (almost the bottom layer of the model) are used. Since this is a reanalysis product, we expect that surface observations (from ships and from satellite estimates) would have been assimilated into the reanalysed data. Thus this is likely...
Continue reading ....
Peering down into the sea surface (from 1000 kms above the earth)
Jason, the successor to the TOPEX/Poseidon satellite, roams roughly 1000 kms above the Earth's surface to provide an estimate of ocean surface topography all over our planet. Thanks to these missions, we have a record of ocean surface topography since 10 Aug 1992.
Let us use the data from these missions to further explore the ongoing IOD. In the last post, I mentioned that the structure of SST anomalies may provide a clue as to how the thermocline has been deformed during the IOD event (the...