Questions and comments may be addressed to Saji N. Hameed by email (saji'at-mark'u-aizu.ac.jp) or from my ResearchGate page
Link to CSC09 class page
Please access the class pages here .
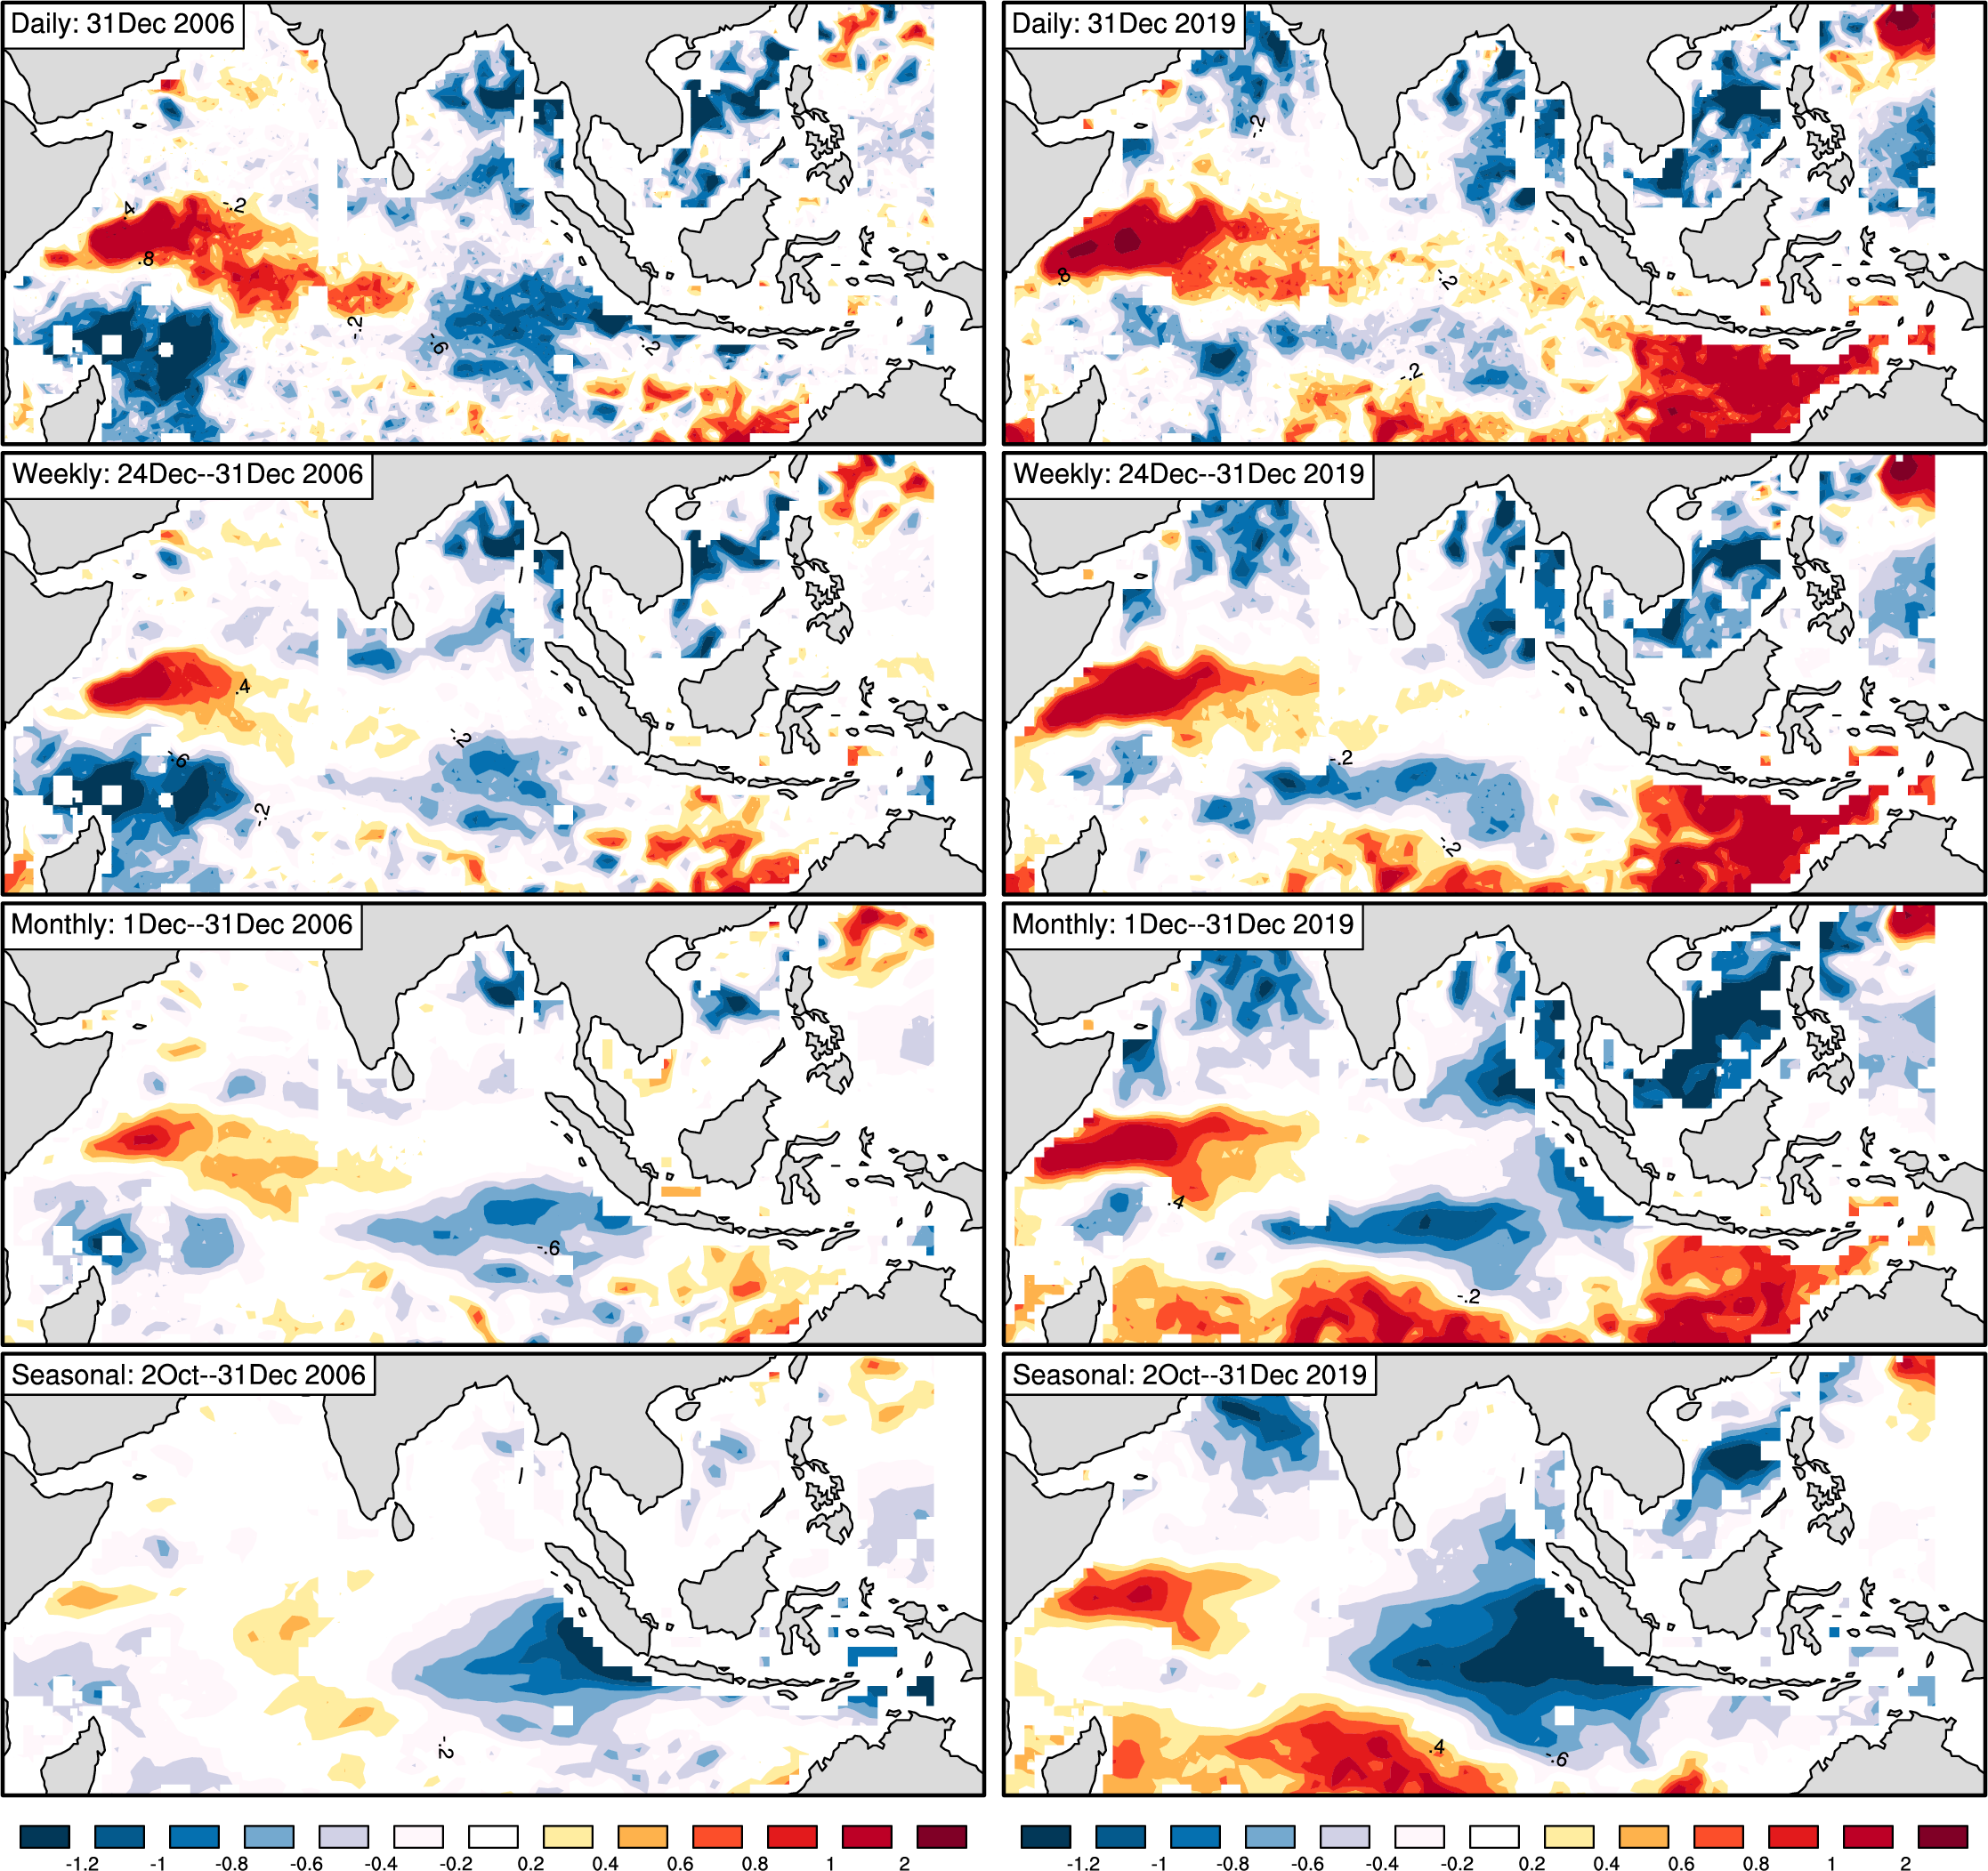
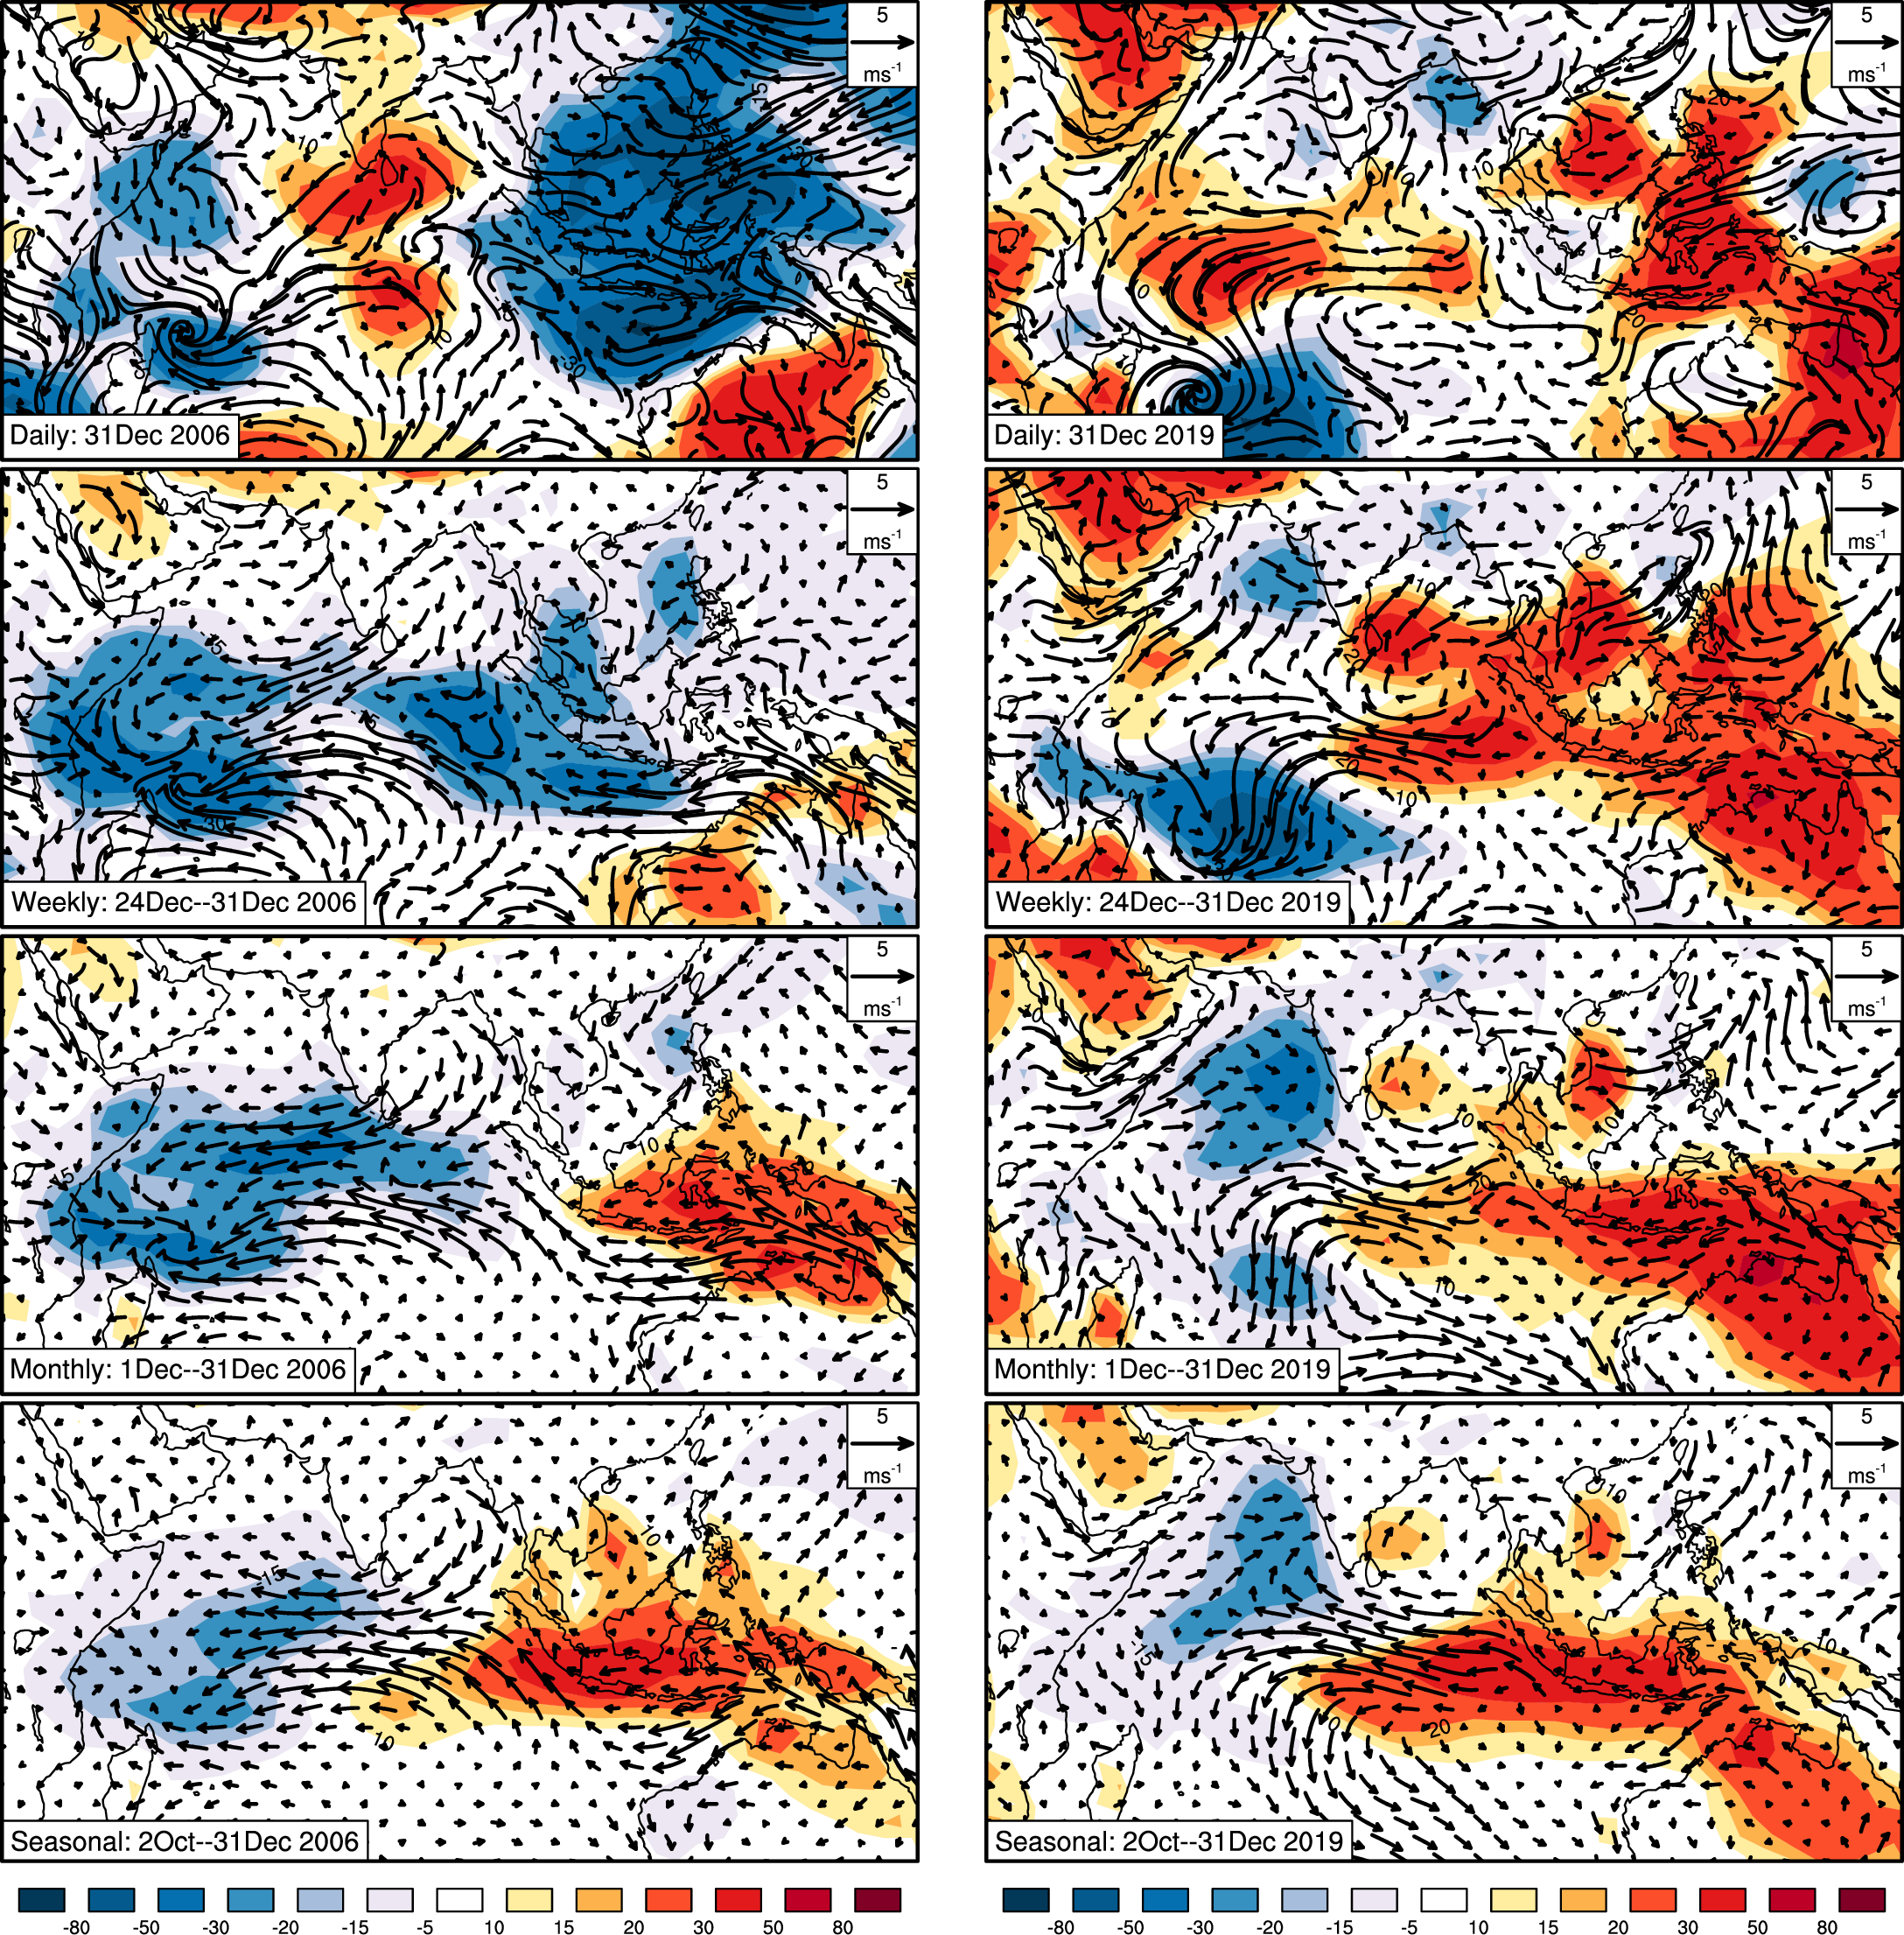
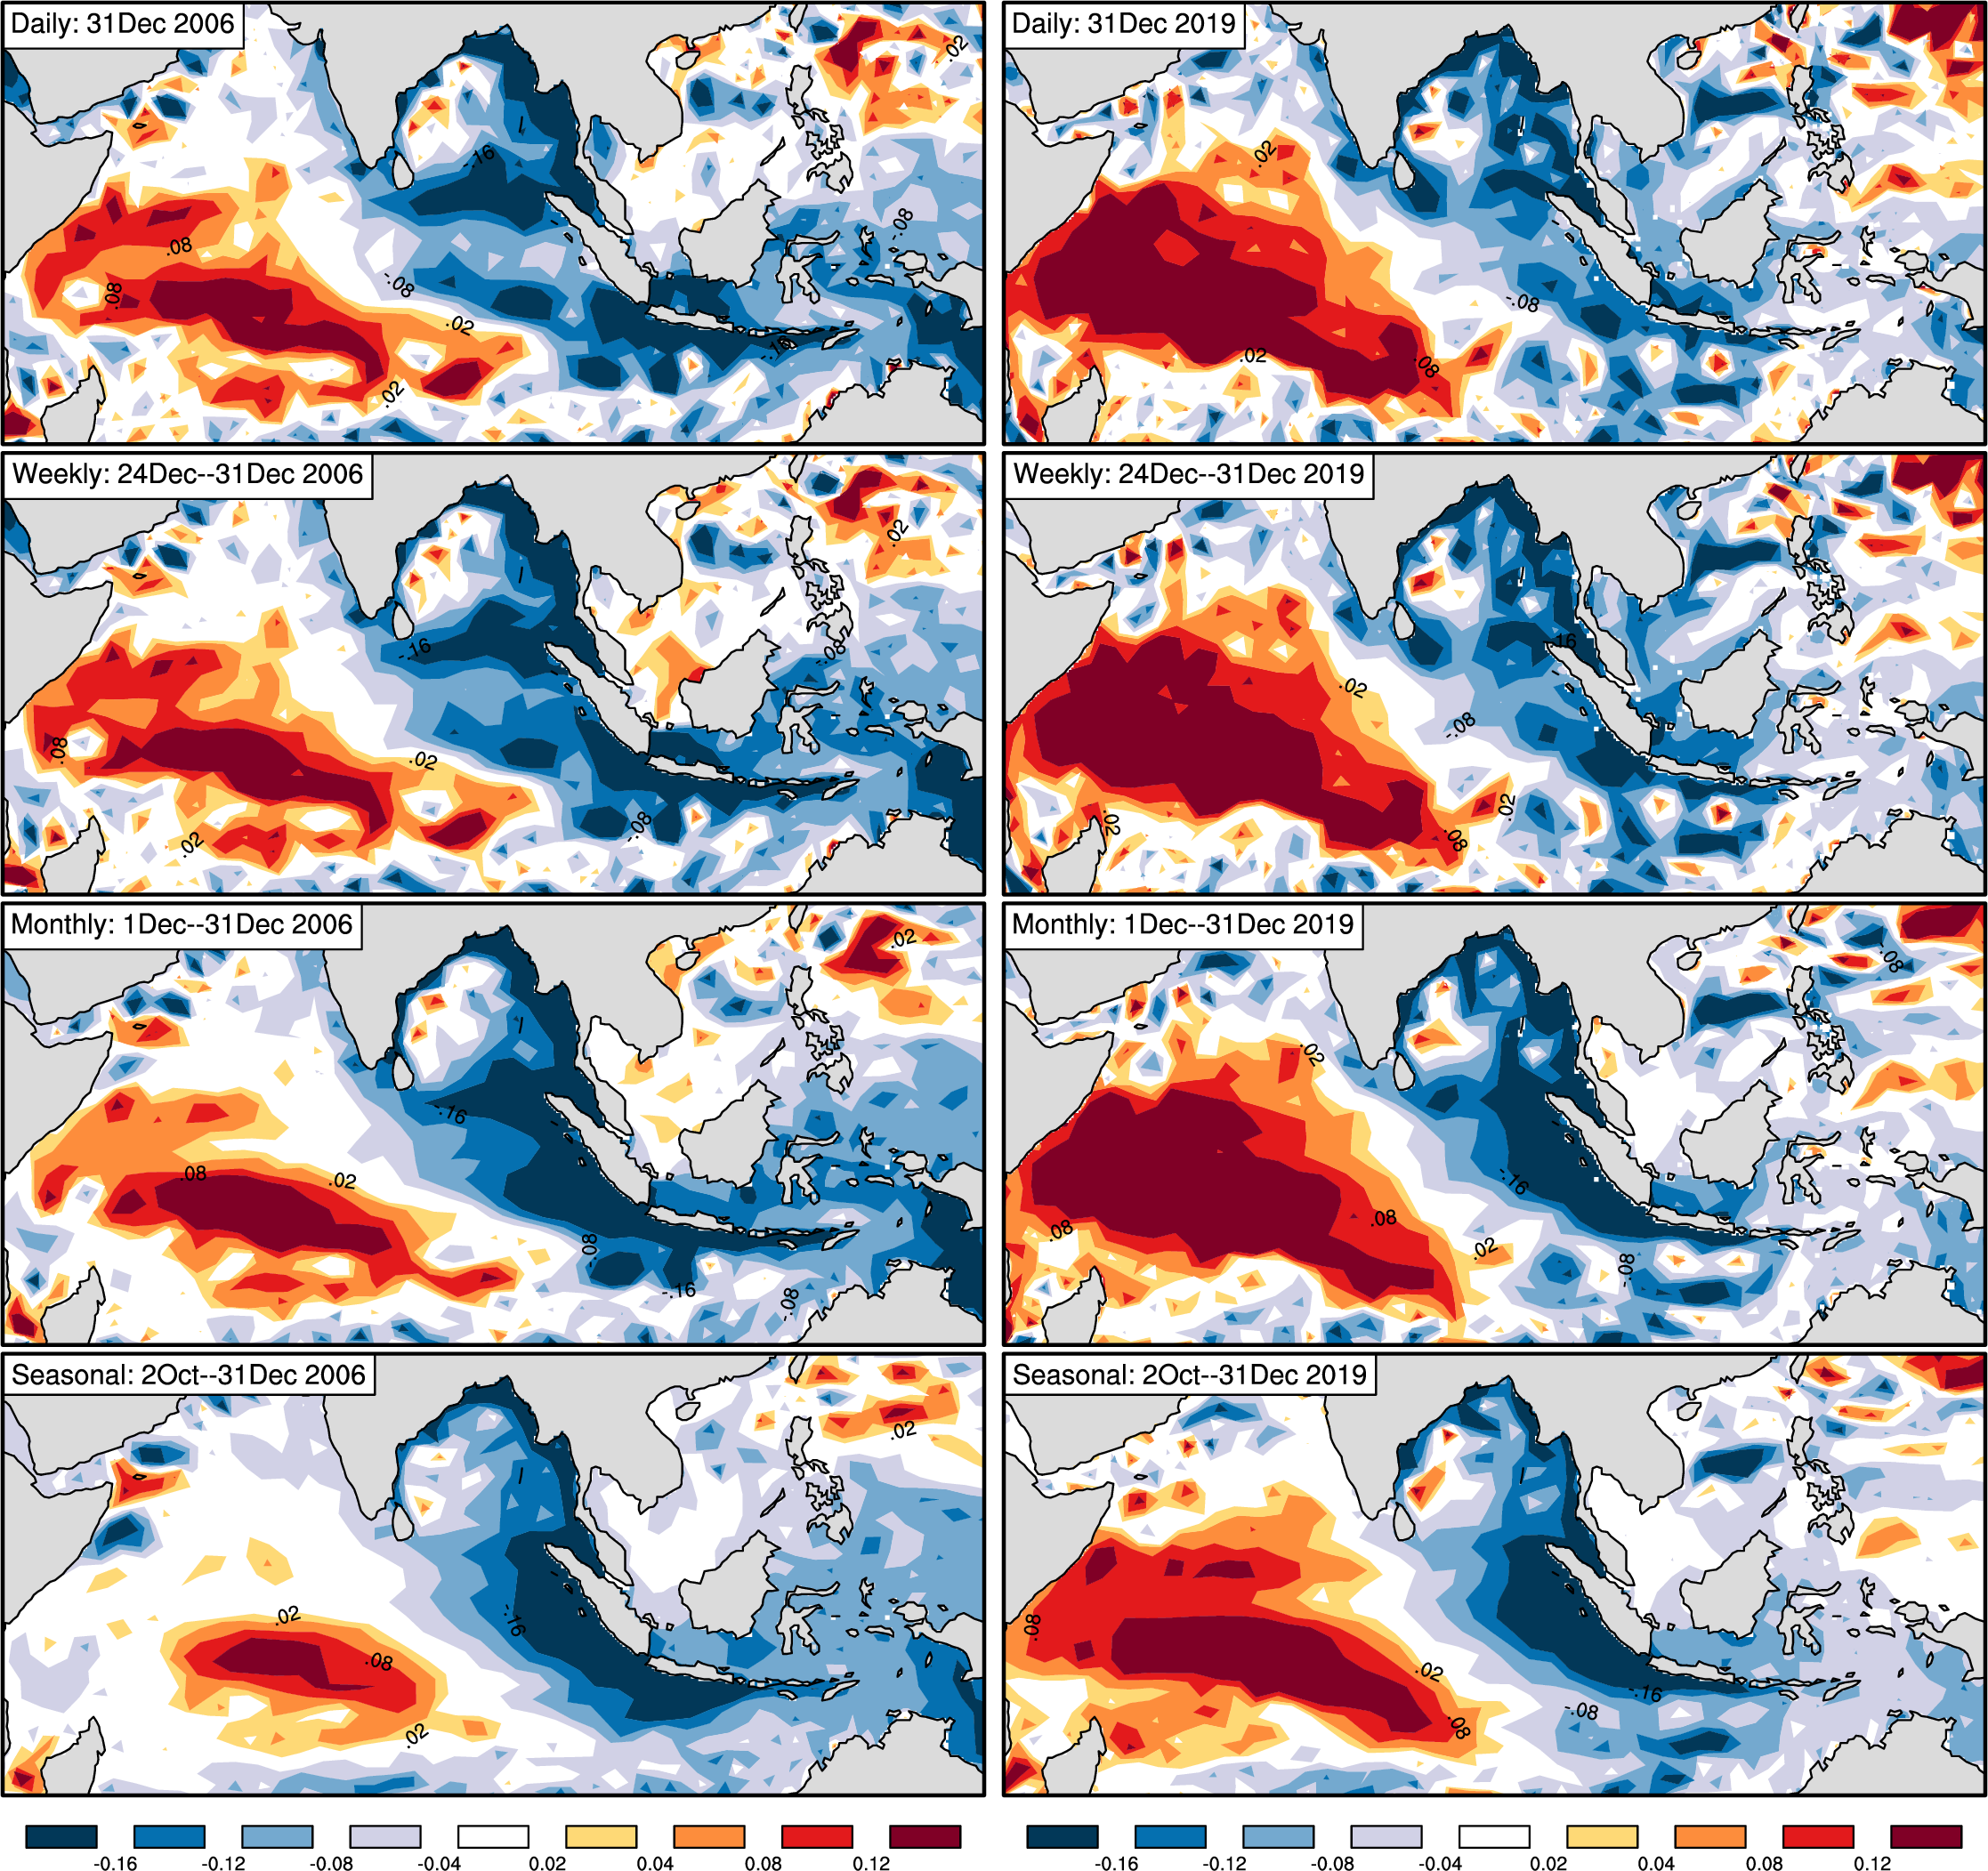
Monitoring the IOD
Analysis of the ongoing IOD at IOD Blog
/*Daily Rain map overlaid on OpenStreet Maps . This is a test visualization. We can try improving aspects of this based on your feedback (email: saji@u-aizu.ac.jp) */
-
Scroll down for plots of mean rainfall over Indian Ocean rim countries
-
Click here
to see detailed rainfall plots over a few selected regions.
- Most figures are updated once in two days or so; Please refresh pages to see if there are updates to the information presented
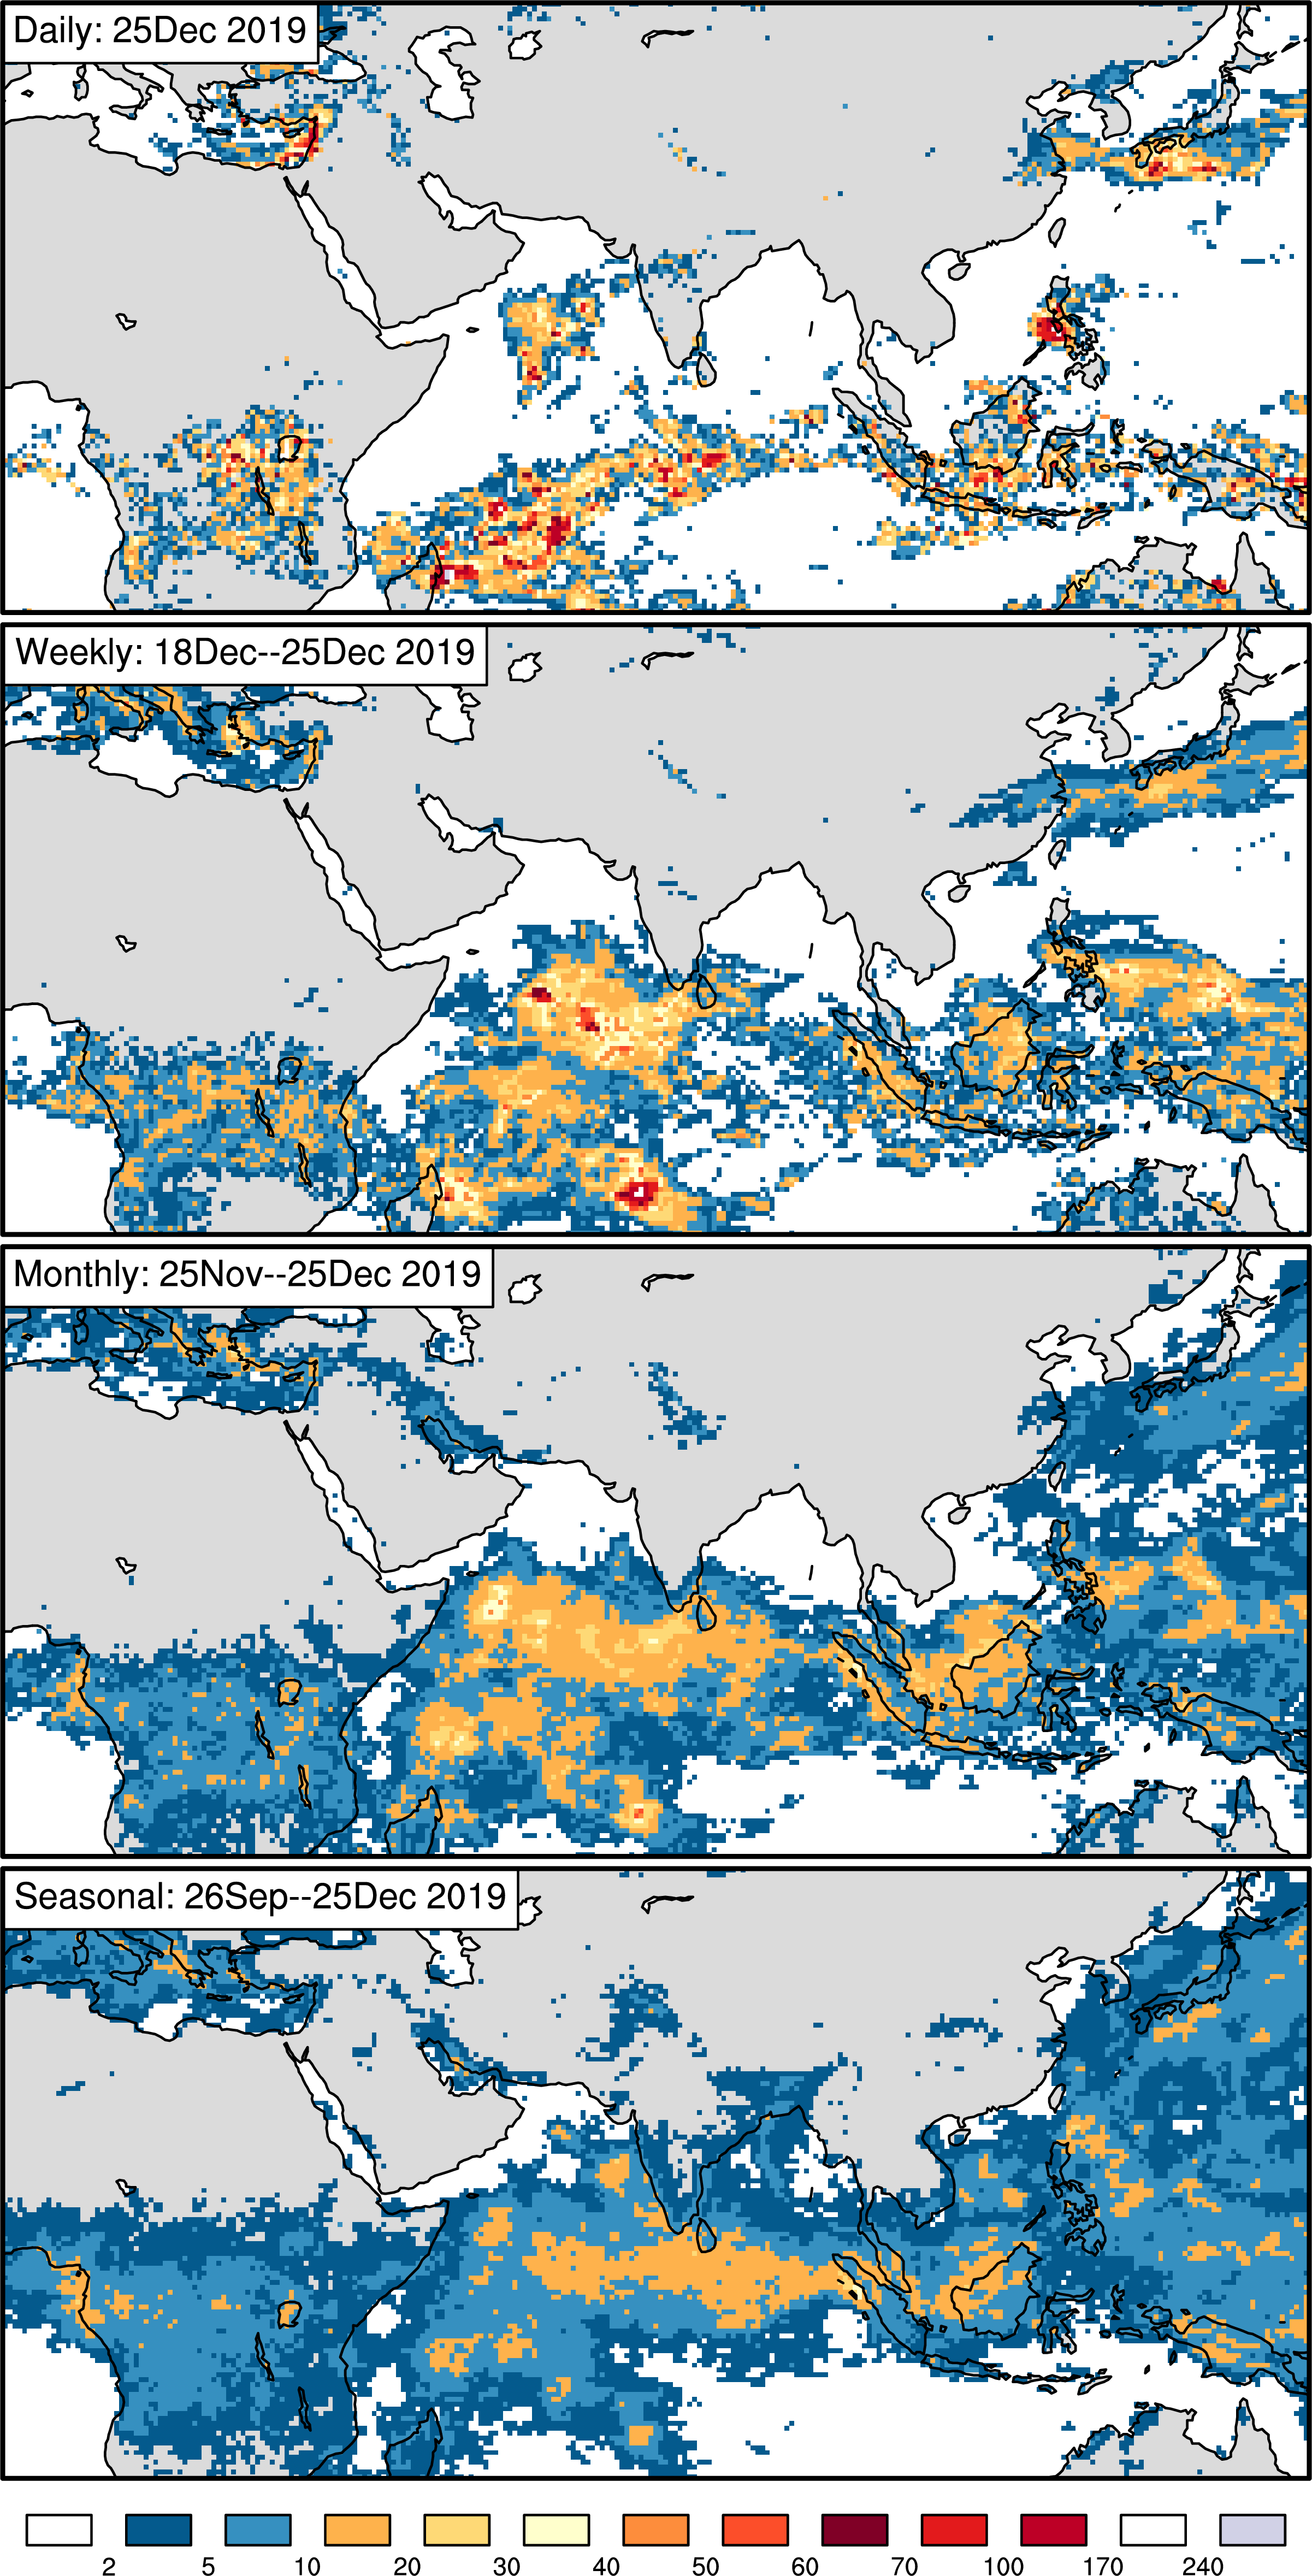
Daily accumulated rainfall (estimated from satellites)
Source: Global Precipitation Mission's IMERG daily rainfall (NASA) Unit: mm
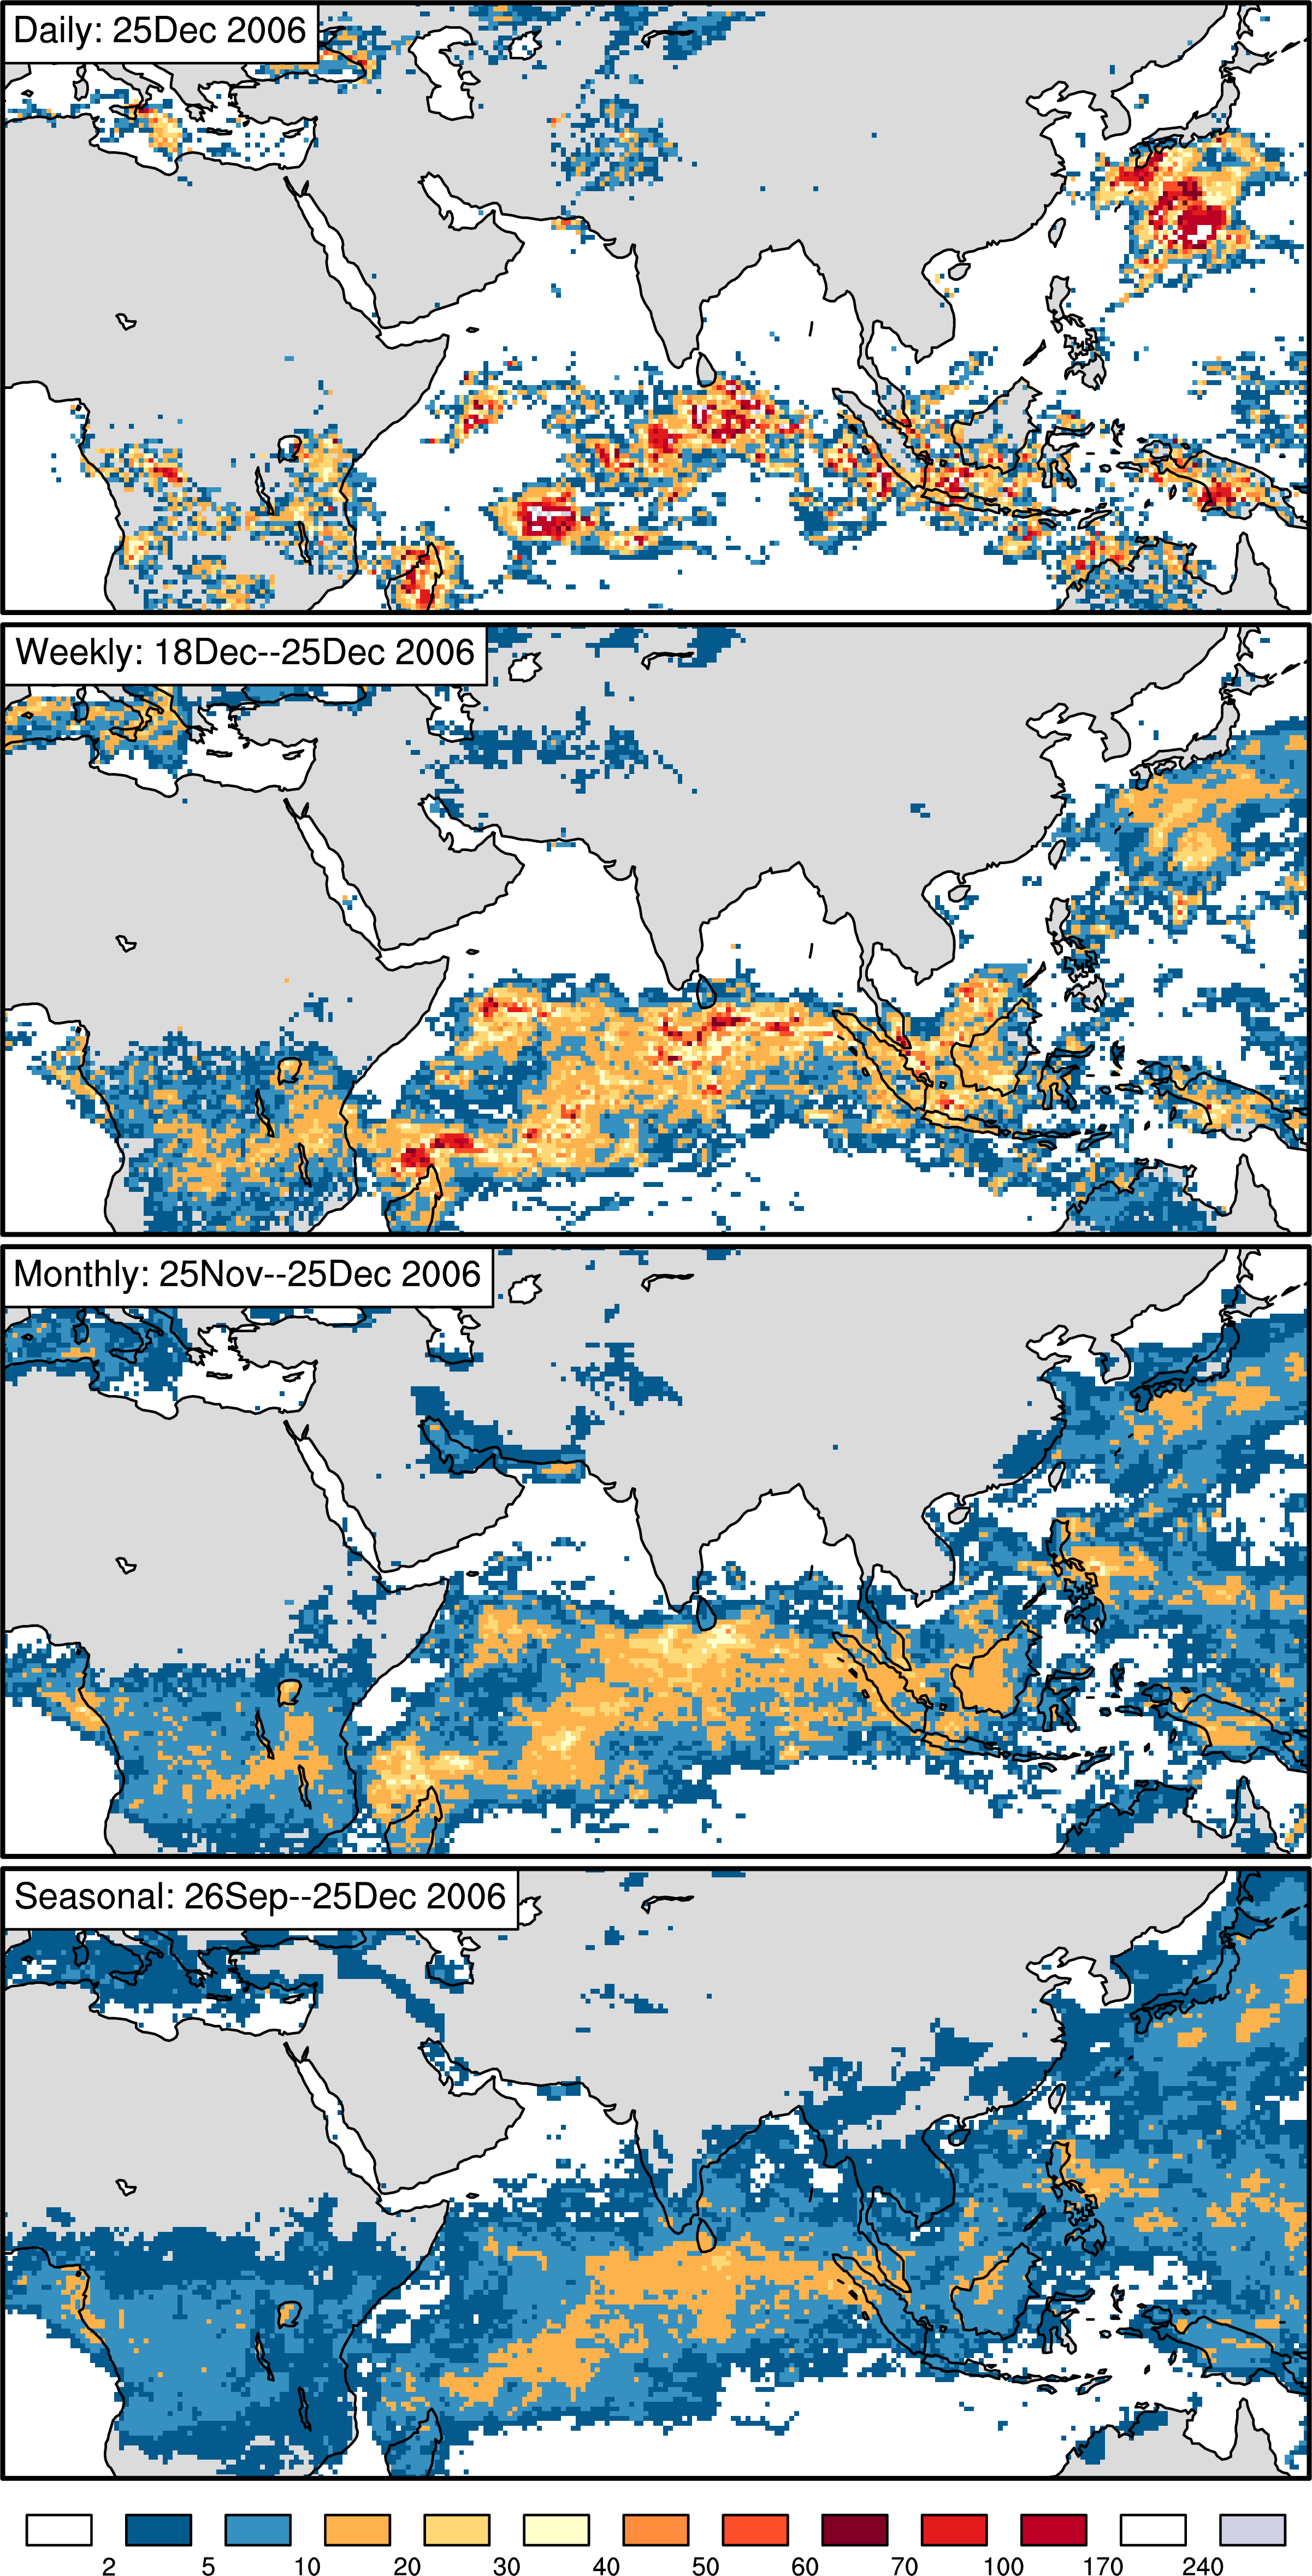
Click here for more detailed rainfall plots over selected regions