Real-time IOD monitoring at IOD Monitor
Questions and comments may be addressed to Saji N. Hameed by email (saji'at-mark'u-aizu.ac.jp) or from my ResearchGate page
The tale of a buoy standing steady.
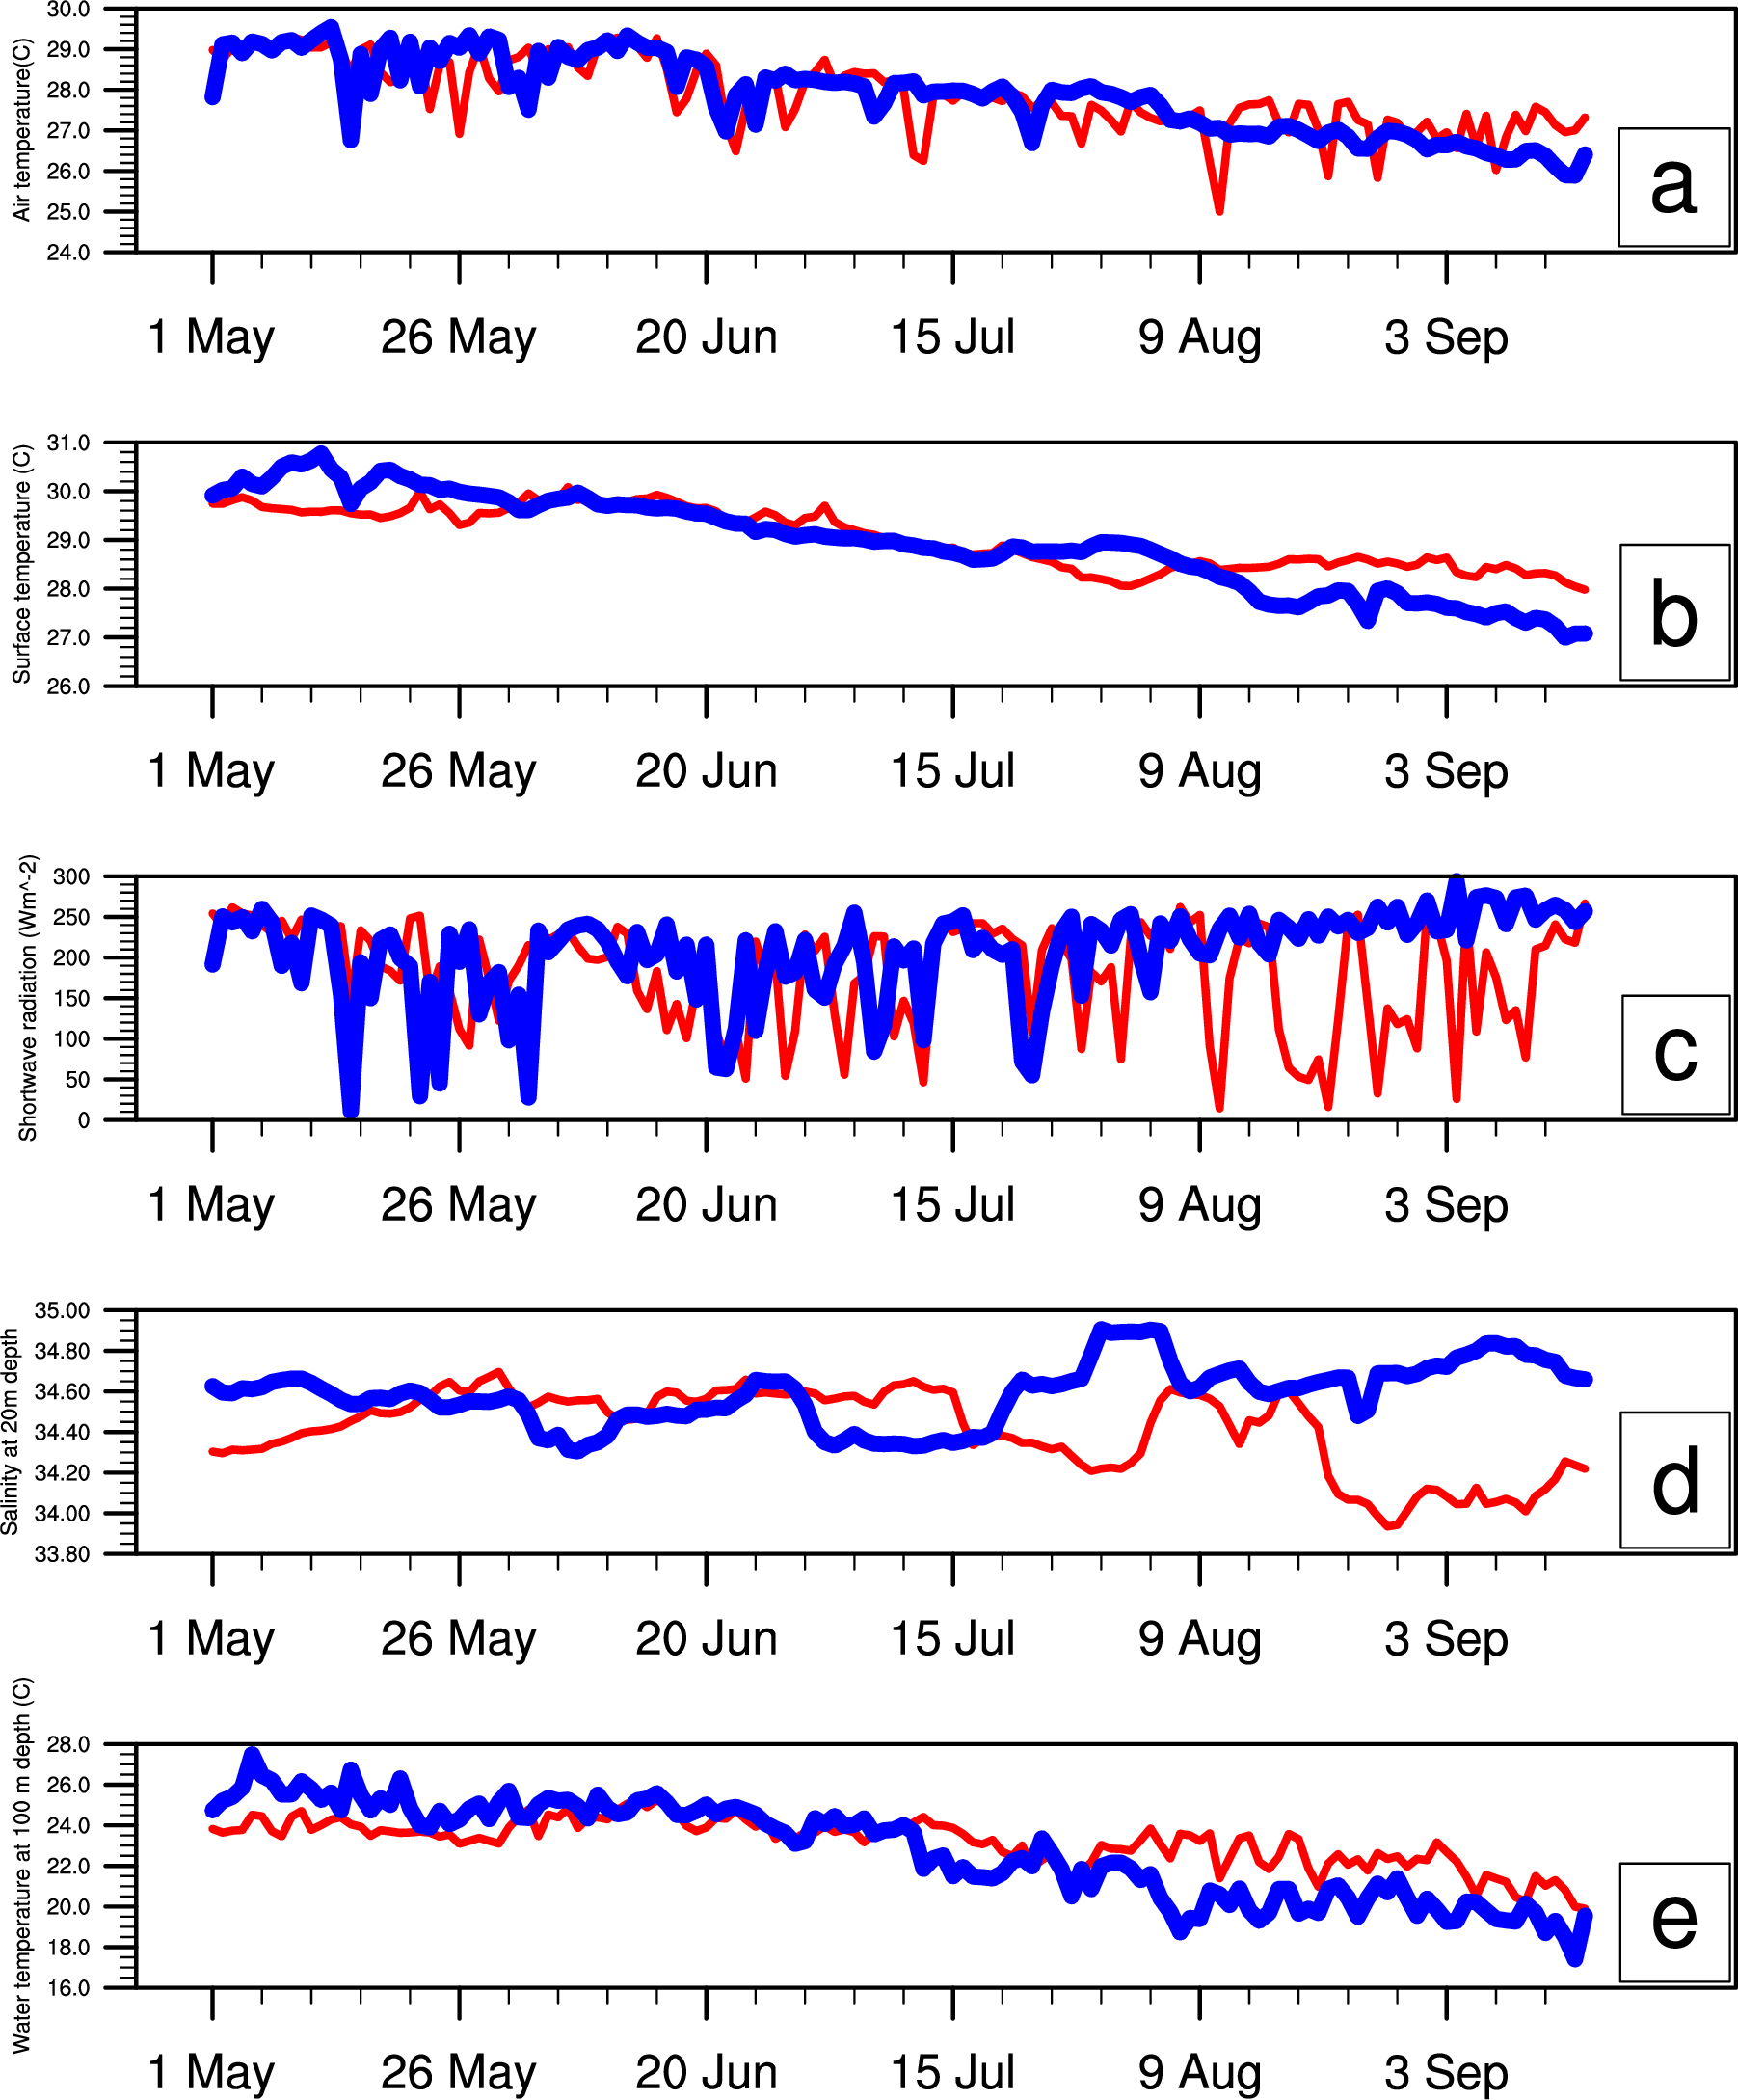
Plots of daily mean (a) Air Temperature, (b) Surface water temperature, (c) Shortwave radiation, (d) Salinity at 20 m depth, and (e) Water temperature at 100m depth. The blue line is for 2019, and the red line is for the year before that (2018).
The data is from a bouy deployed by JAMSTEC at 5 South latitude, and 95 E longitude (in plain words, just to the west of Sumatra island)
Do you see what I see? Or, am I imagining things?