Real-time IOD monitoring at IOD Monitor
Questions and comments may be addressed to Saji N. Hameed by email (saji'at-mark'u-aizu.ac.jp) or from my ResearchGate page
Soaring above the seas and into the clouds!
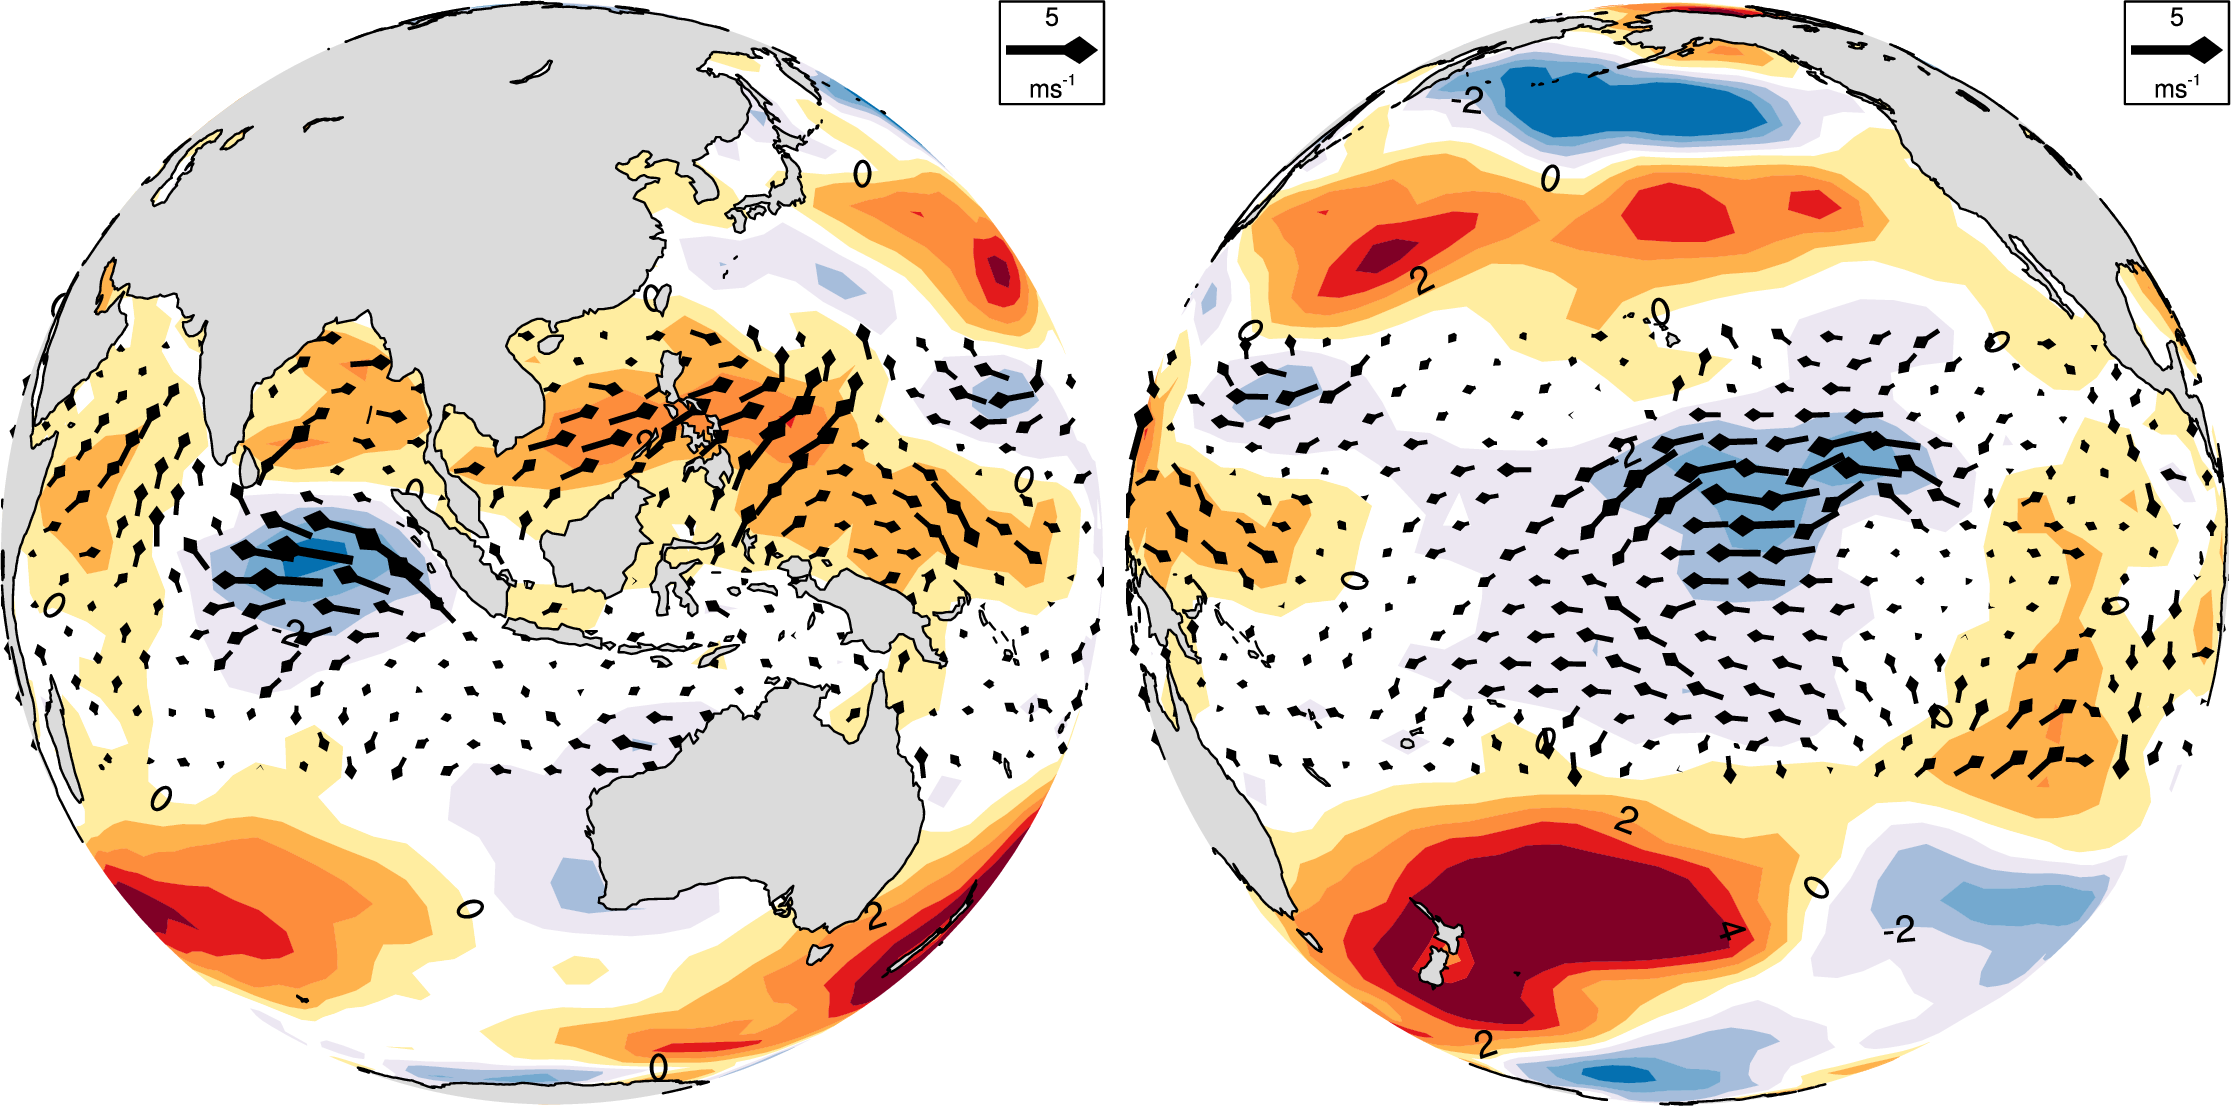
The wind anomalies at the surface of the tropical Indian ocean (left) and tropical Pacific ocean (right) are plotted as vectors in the figure above. The data used is from the NCEP reanalysis I (NCEPR1) project, and winds at the NCEPR1 model's sigma 0.995 level (almost the bottom layer of the model) are used. Since this is a reanalysis product, we expect that surface observations (from ships and from satellite estimates) would have been assimilated into the reanalysed data. Thus this is likely close to real observations, and not a pure simulation product. If you are wondering what the shaded contours are, they are the zonal component of the wind anomaly (shown also beyond the tropics).
What is really striking about the figure is that the wind anomalies are so clearly organized. Look at the eastern equatorial Indian Ocean. You can see a zone of strong easterly anomalies that are symmetrically located about the equator. The southern and northern flanks of this zone has a clear anticylonic curvature to it, with the southern anticyclone the more well developed and clear.
North of the equator, over most of the maritime continent, the wind anomalies are westerly and extend over into the far-western tropical Pacific Ocean. Have you seen these features before?
Well, these features are typical of IOD events, as you can see from Not only do the wind anomalies resemble the IOD's signature evaluated from historical observations, but it can also be dynamically related to the structure of deep convective anomalies (see plot below).
By deep convection, we refer to those towering cumulo-nimbus complexes in the tropics that rise above the warm waters of the Indo-Pacific warm pool and the adjoining land masses. They play an important role in the vertical distribution of heat. As you all know, the gases present in our atmosphere are not very good at absorbing the short-wavelength visible radiation sent out by the sun, while the infra-red radiation emitted by the earth is just not enough to warm up the atmosphere. It is these cumulo-nimbus cloud complexes that pump heat from the surface deep into the atmosphere (troposphere, to be more correct) and maintain its heat content. Any variations to the frequency of cumulo-nimbus clouds have a significant impact on the tropical atmosphere. Such variations change pressure distributions in the tropical troposphere through variations in the heat pumped up by these cloud complexes. Pressure variations naturally lead to changes in winds. Two questions arise: how do we monitor these cloud complexes, and how do we ascertain that the observed (reanalysed) wind anomalies are consistent with the changes in convective activities.
One technique to monitor these cumulonimbus complexes and other clouds from satellites is to collect infrared radiation pouring from the earth's atmosphere into satellite's sensors. In the atmosphere, the tallest objects are typically cumulo-nimbus clouds and with their cloud tops being nearly in equilibrium with the surrounding atmosphere will have the coolest temperature of all objects floating in our troposphere (the troposheric temperature cools down as we go up, and the tallest cloud top will have the coolest temperature). Thus, we can more or less, identify tall cumulonimbus complexes in the tropics by looking at the infra-red radiation outpouring (outgoing longwave radiation) from the earth and its atmosphere.
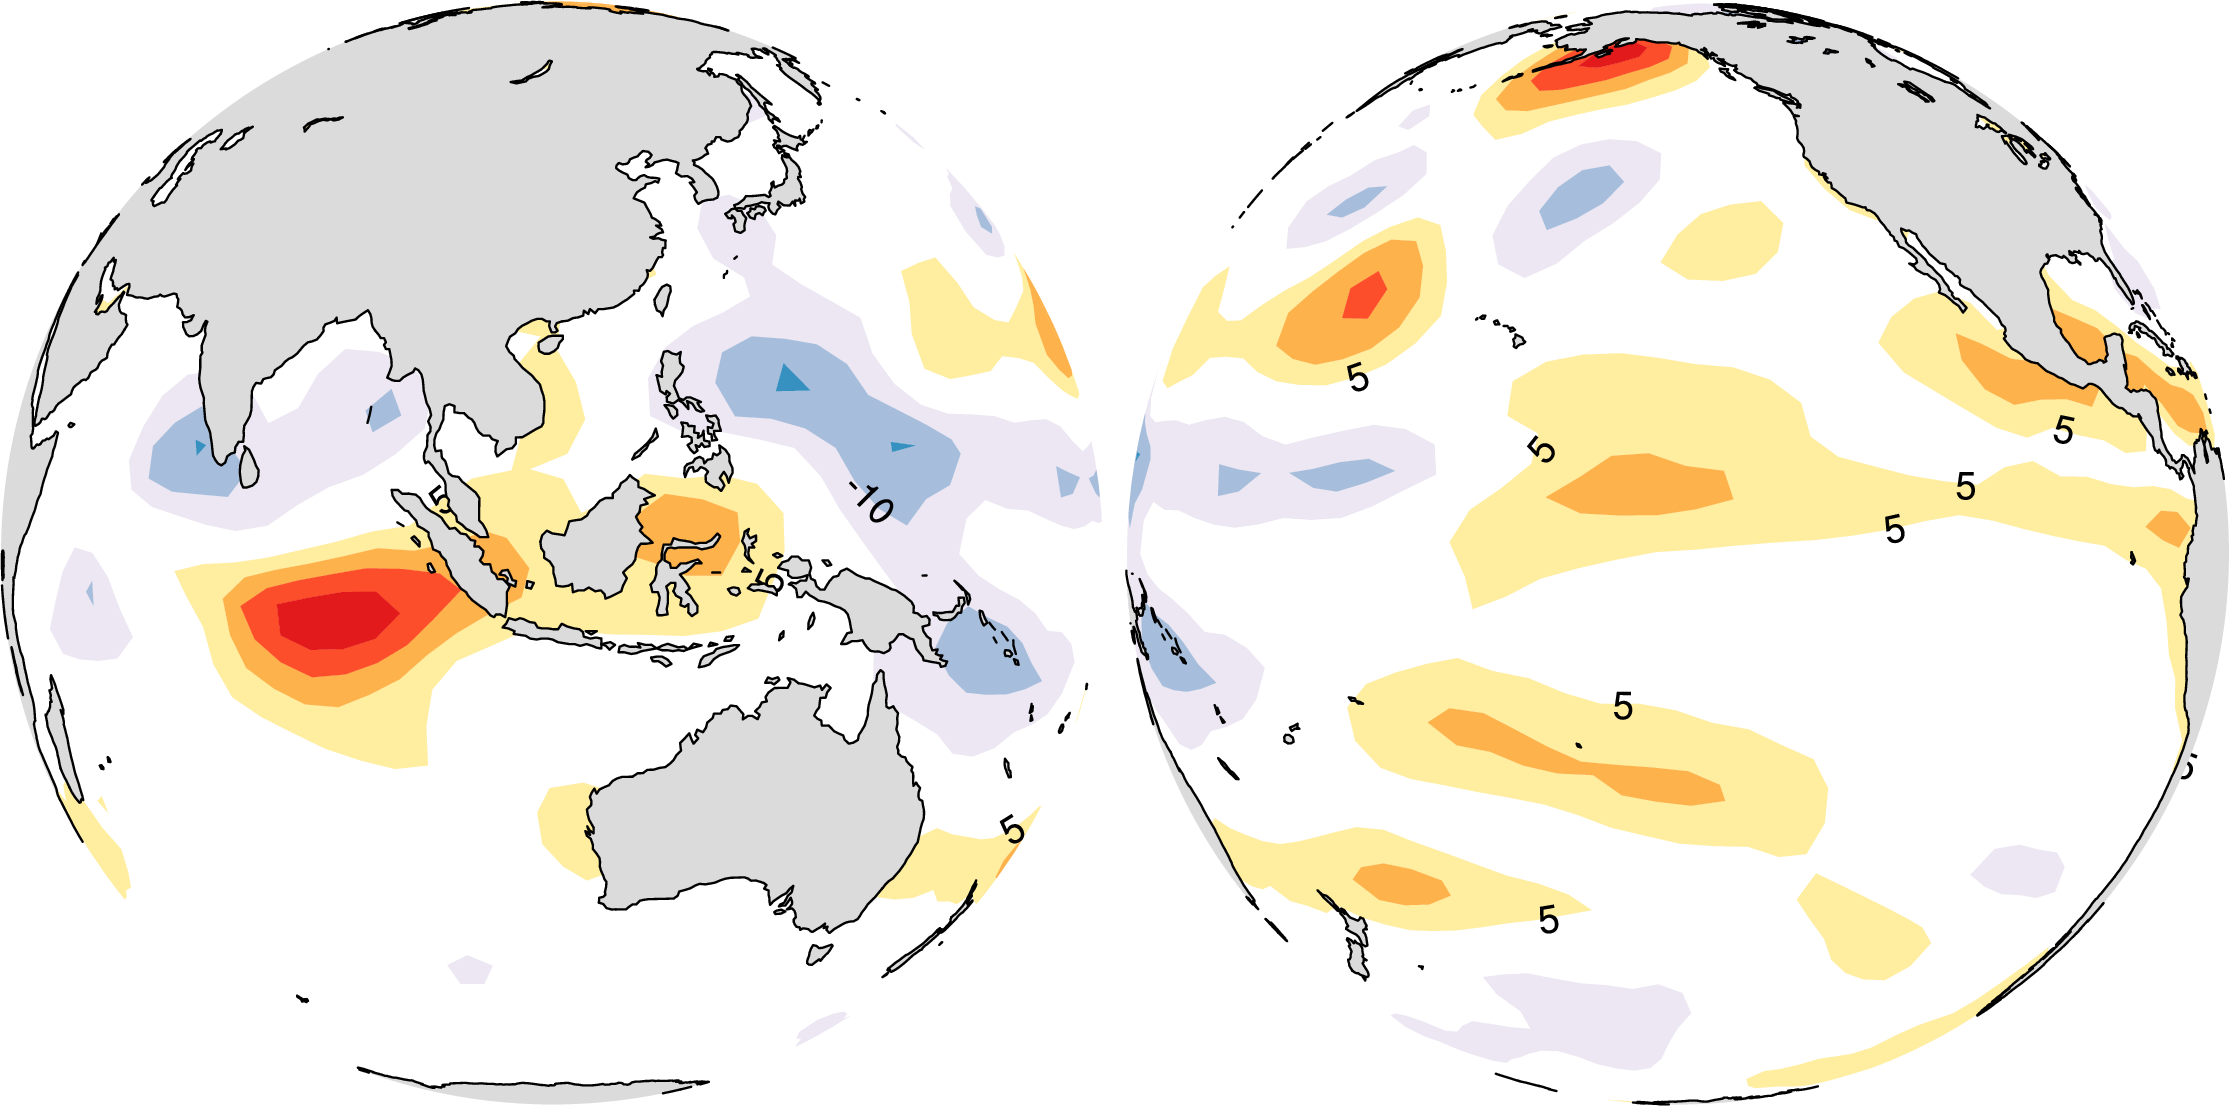
The figure below plots anomalies of Outgoing Longwave Radiation (OLR) anomalies during August 2019. As discussed above, we can associate OLR with deep convection, and hence use OLR as a proxy for the latter. These days there are advanced sensors that can directly detect the amount of rainfall (which provides a measure of how much the atmosphere was heated up by these cumulo-nimbus clouds), but since OLR is continuously available since the 1970's we use it for convenience of long-term analysis.
The shaded quantity plotted in is not OLR, but plain cloudiness estimated by mariners onboard mostly merchant ships plying the oceans. Over the warm pool region, deep convection is present throughout the year and we can consider (the spatial structure of deep convection).
The OLR anomalies over the eastern Indian Ocean during the ongoing IOD are very similar to the marine cloudiness anomalies plotted in Both show that deep convection is suppressed over the eastern Indian Ocean during an IOD event, and we can relate this to the cool SST anomalies underlying the convection. The region under consideration, the southeastern equatorial Indian Ocean has Cooling this region therefore has a dramatic impact on deep convection over the southeastern equatorial Indian Ocean.
Having reconstructed the structure of convective anomalies over the eastern equatorial Indian Ocean, we can try relating it to the surface winds underneath and adjacent to it. Qualitatively speaking, reduction of convection means less heat supply to the troposphere and higher pressures in the region of reduced convection relative to its surroundings, and associated anticylonic wind field. To get a more detailed structure, we can try driving an atmospheric model with the estimated tropospheric heating anomalies, and this simulated field of surface wind anomalies are shown in The shaded contours in those figures are the estimated tropospheric heating anomalies used in the model. (BTW, this model is a so-called Linear Baroclinic Model, a primitive equation atmospheric model linearized about a specified mean state;
To conclude, we are witnessing before our very eyes a most marvelous phenomenon of the tropical ocean and atmosphere, which has not only distinctive features, but about which we can rationalize and understand based on elementary aspects of tropical dynamics. I hope you will enjoy dissecting this phenomenon as much as I do.