Real-time IOD monitoring at IOD Monitor
Questions and comments may be addressed to Saji N. Hameed by email (saji'at-mark'u-aizu.ac.jp) or from my ResearchGate page
Peering down into the sea surface (from 1000 kms above the earth)
Jason, the successor to the TOPEX/Poseidon satellite, roams roughly 1000 kms above the Earth's surface to provide an estimate of ocean surface topography all over our planet. Thanks to these missions, we have a record of ocean surface topography since 10 Aug 1992.
Let us use the data from these missions to further explore the ongoing IOD. In the last post, I mentioned that the structure of SST anomalies may provide a clue as to how the thermocline has been deformed during the IOD event (the thermocline is deformed by the action of the winds blowing on the surface of the ocean). Did you guess what form the thermocline deformation takes on?
You can confirm your prediction from the plot below. It shows anomalies of Absolute Dynamic Topography during the month of August.
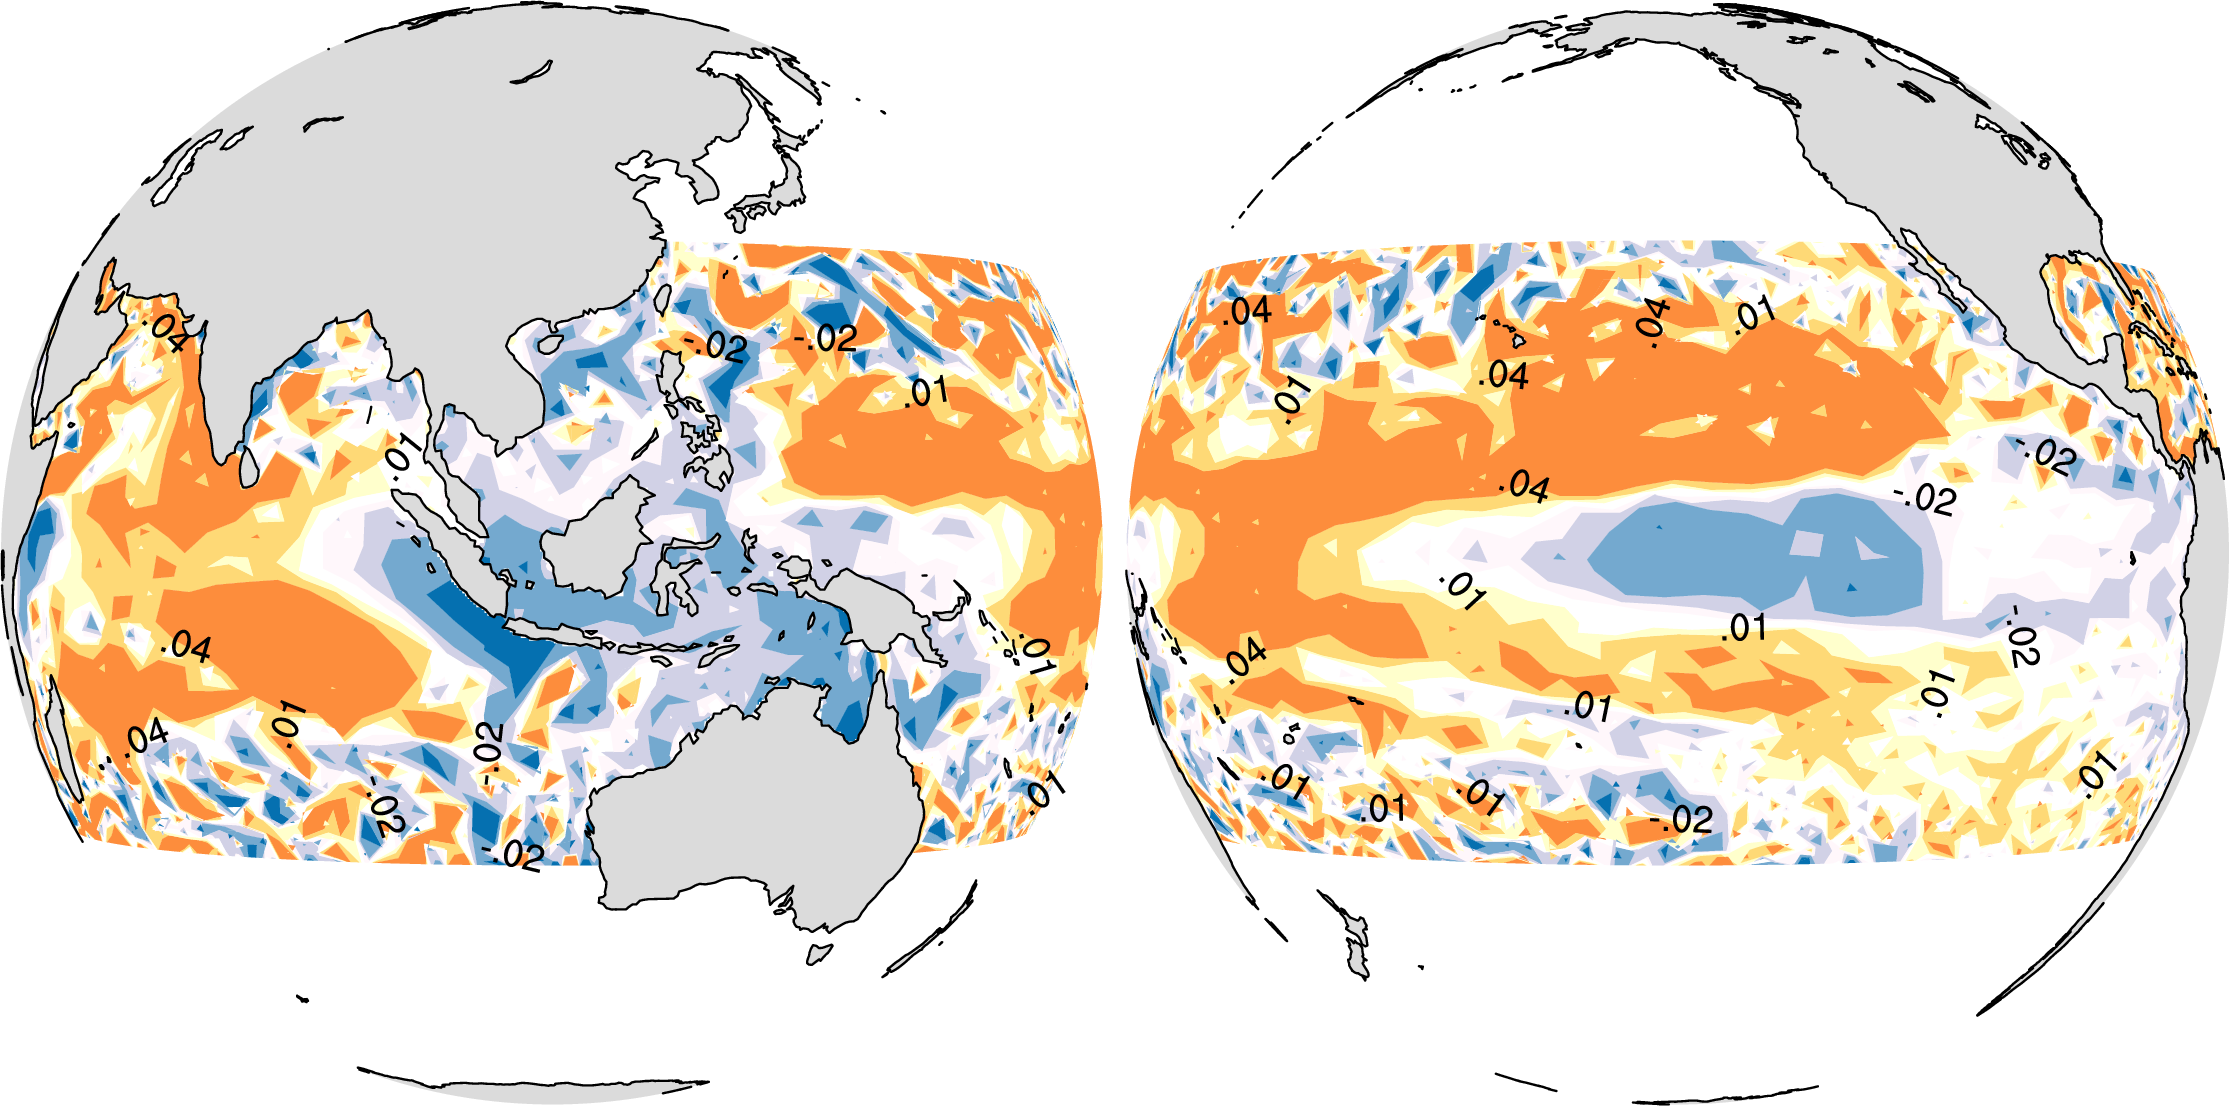
Time to open your oceanography textbooks, and enjoy the signatures of equatorial oceanic Kelvin and Rossby waves, and ponder on their role during IOD!
Finally, why am I using an observation of the sea surface topography and claiming that it represents the shape of thermocline anomalies deep under the sea surface?