Real-time IOD monitoring at IOD Monitor
Questions and comments may be addressed to Saji N. Hameed by email (saji'at-mark'u-aizu.ac.jp) or from my ResearchGate page
At last --- an IOD that I can watch evolve!
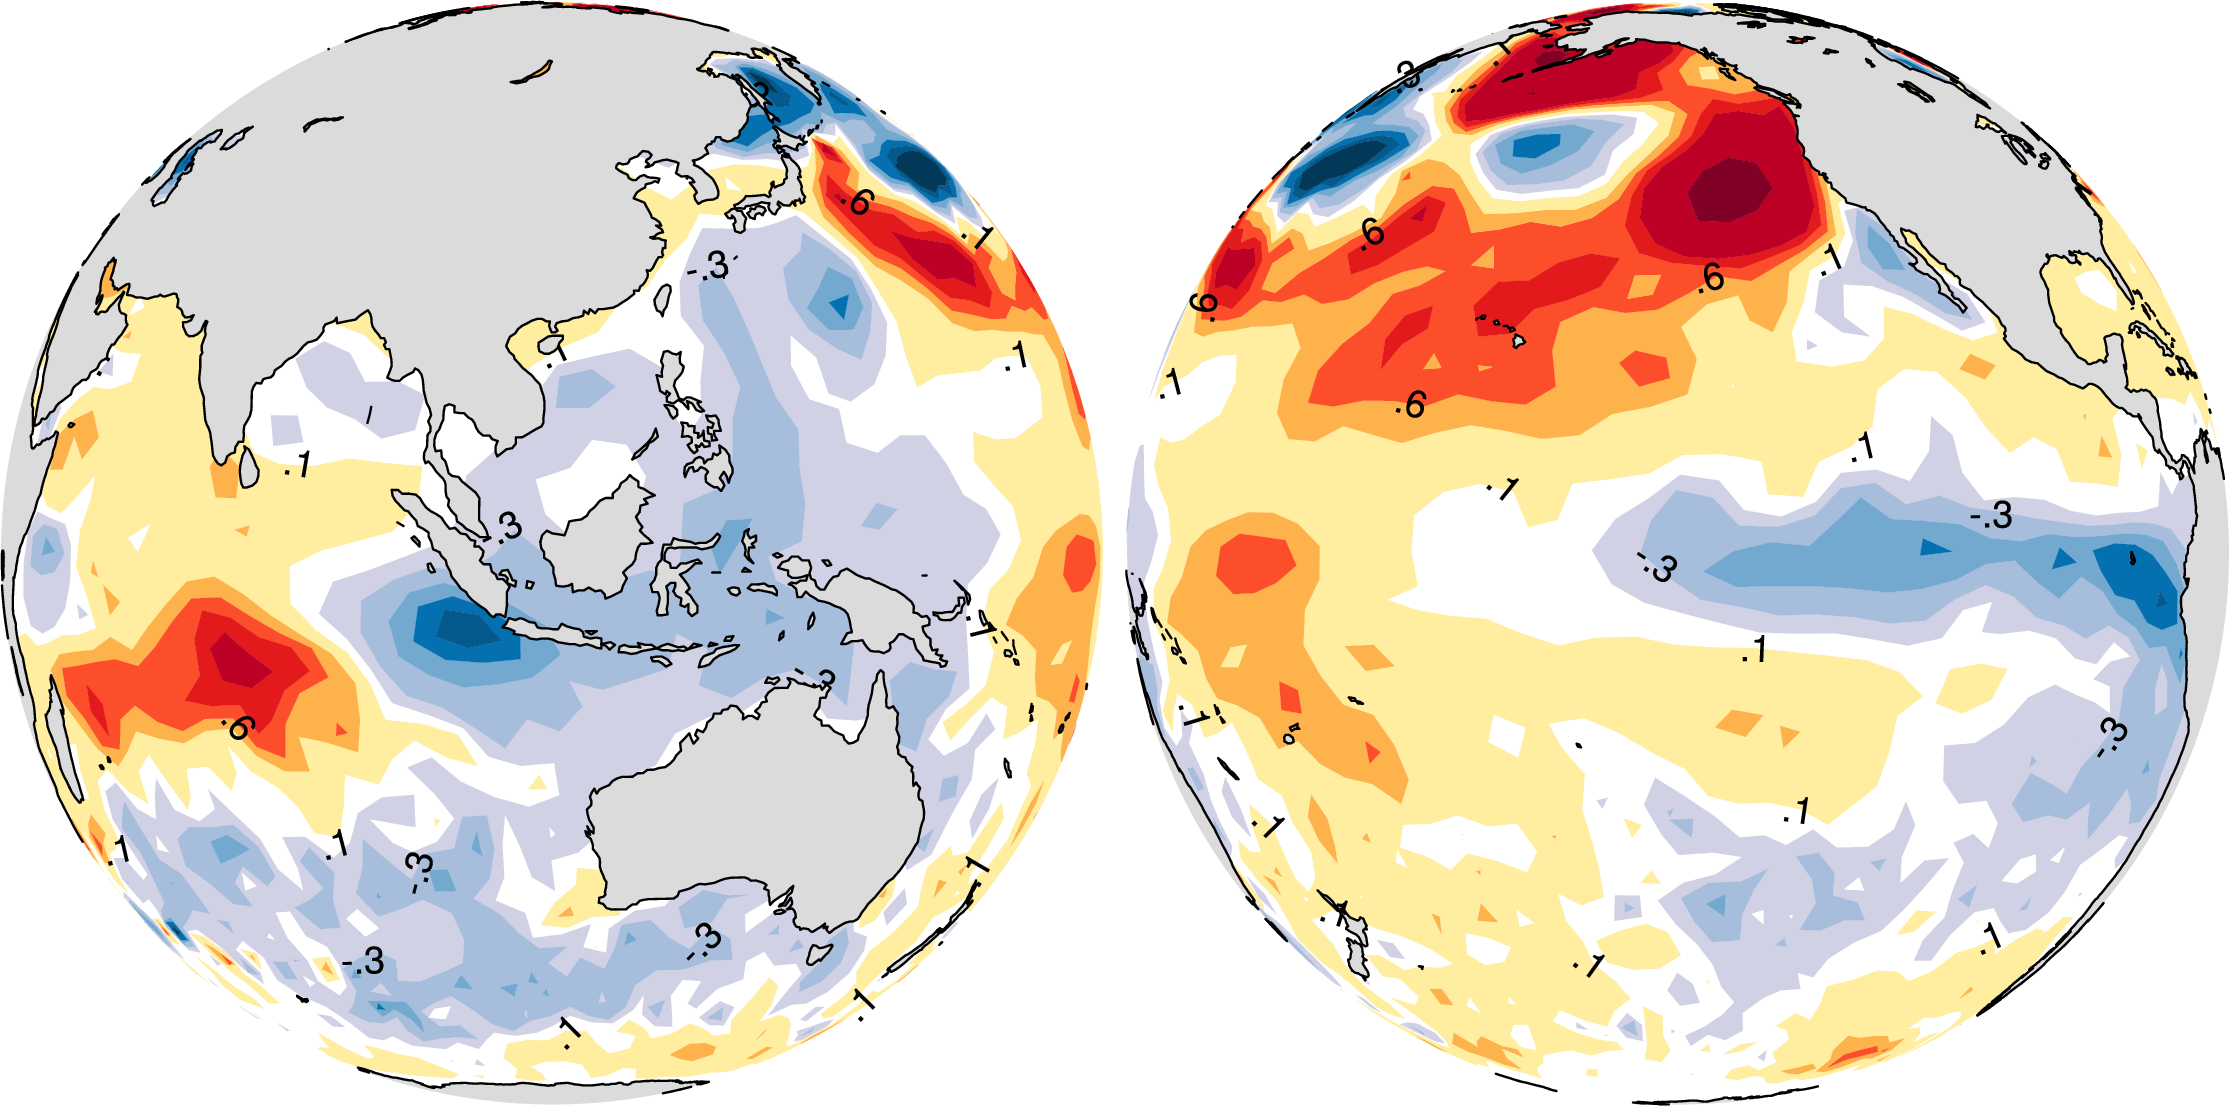
The figures above show SST anomalies during August 2019. I chose a "Satellite projection", so that the equatorial regions are zoomed in, and form the focal point of your attention. In these figures, I have detrended the data before plotting (the real-time plots still are not de-trended; you may notice the underlying global warming signature in those real-time plots).
On the left is the SST anomaly over the Indian Ocean. You can see a classic IOD SST pattern developing: cool SST anomalies off Java and southern Sumatra with cool SST anomalies covering also the shallow-seas of the maritime continent. Notice that the SST anomalies are strongest south of the equator, with almost no cooling north of the equator (in fact, you can see warm SST anomalies off northern Sumatra). To the west of approximately 80E, you can see warm SST anomalies; however, here the SST anomaly is rather symmetric about the equator. Folks familiar with the structure of oceanic Rossby waves at the equator may imagine the underlying structure of thermocline anomalies through these warm SST anomalies.
Over the Pacific, there is a surprise waiting for many folks familiar with the IOD phenomenon. There are cool SST anomalies in the eastern Pacific. If you were one of those who associate IOD with El Nino, here is an event that tickles your judgement. There are warm SST anomalies in the western Pacific though. You may be wondering, if this is a La Nina or the El Nino Modoki. Well, I will present my thoughts on this topic in a future post. You are welcome to present your analysis and thoughts.