Real-time IOD monitoring at IOD Monitor
Questions and comments may be addressed to Saji N. Hameed by email (saji'at-mark'u-aizu.ac.jp) or from my ResearchGate page
How strong is the 2019 IOD?
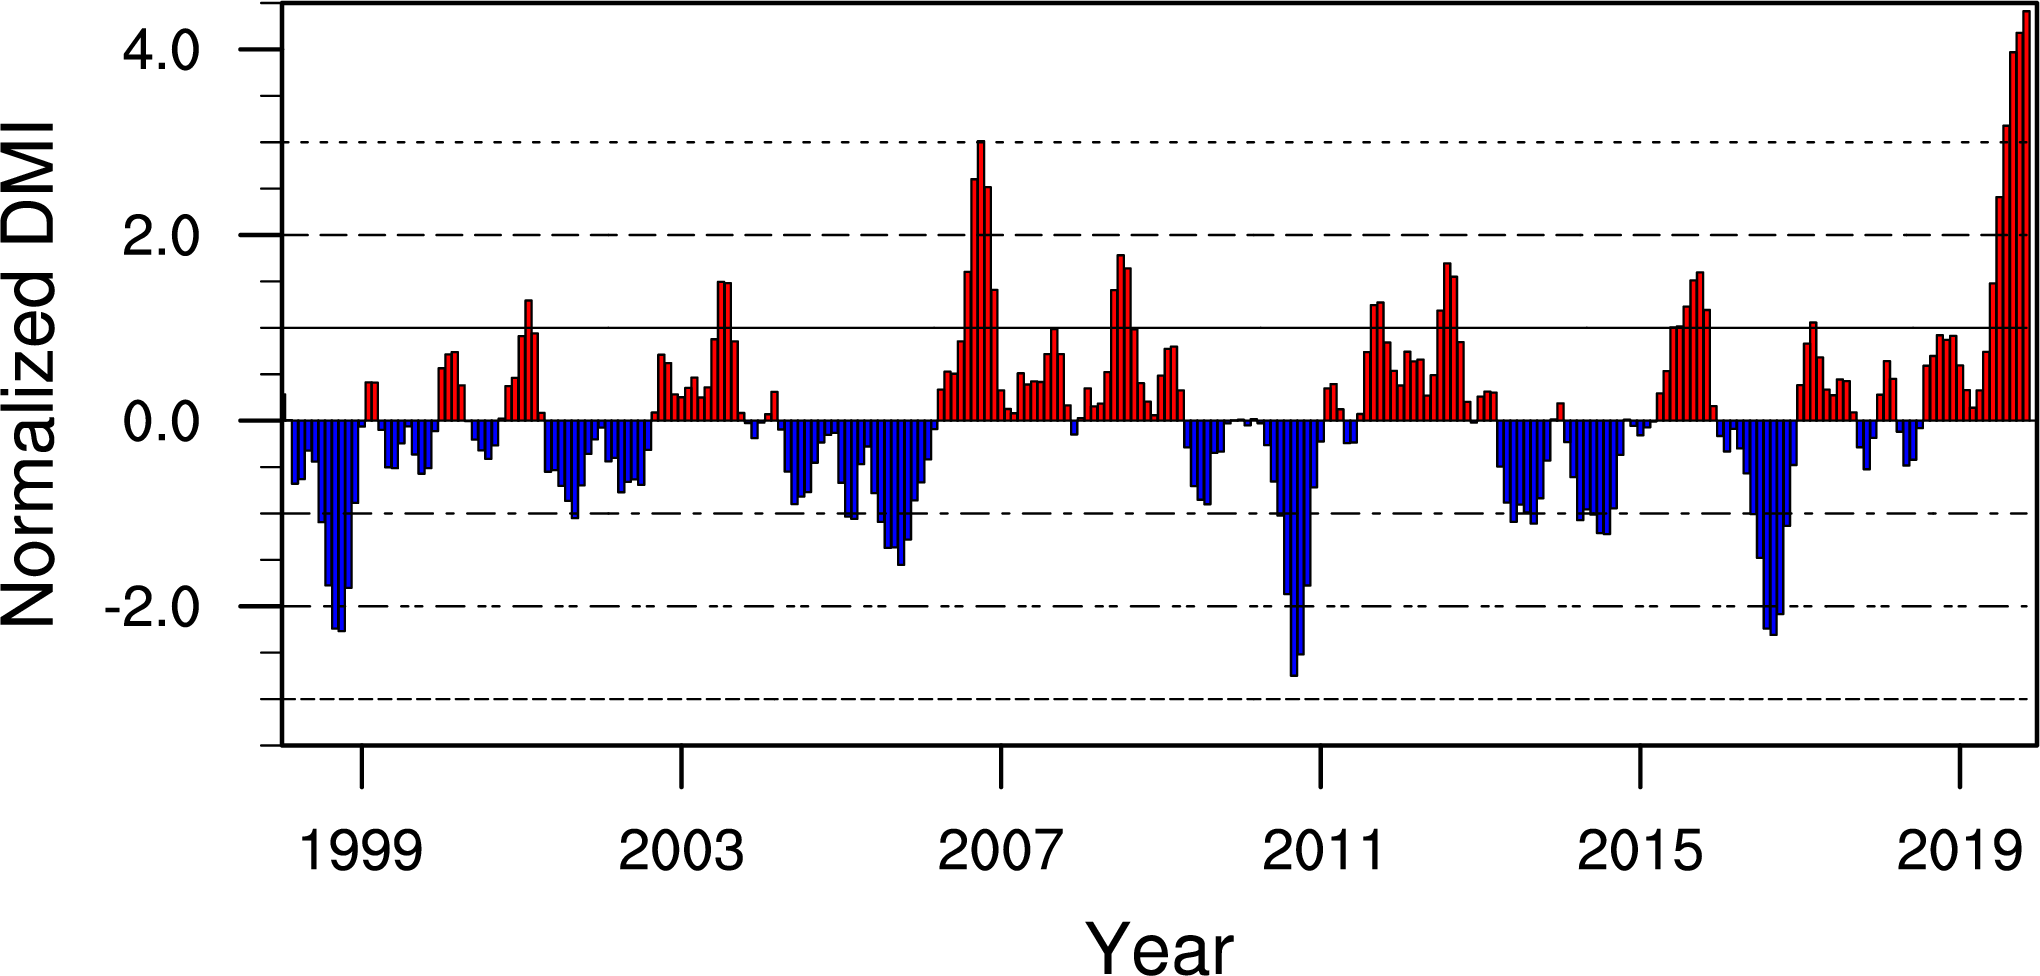
A plot of monthly DMI from Jan 1998 to Aug 2019. The strongest event prior to 2019 in this plot is 2006.
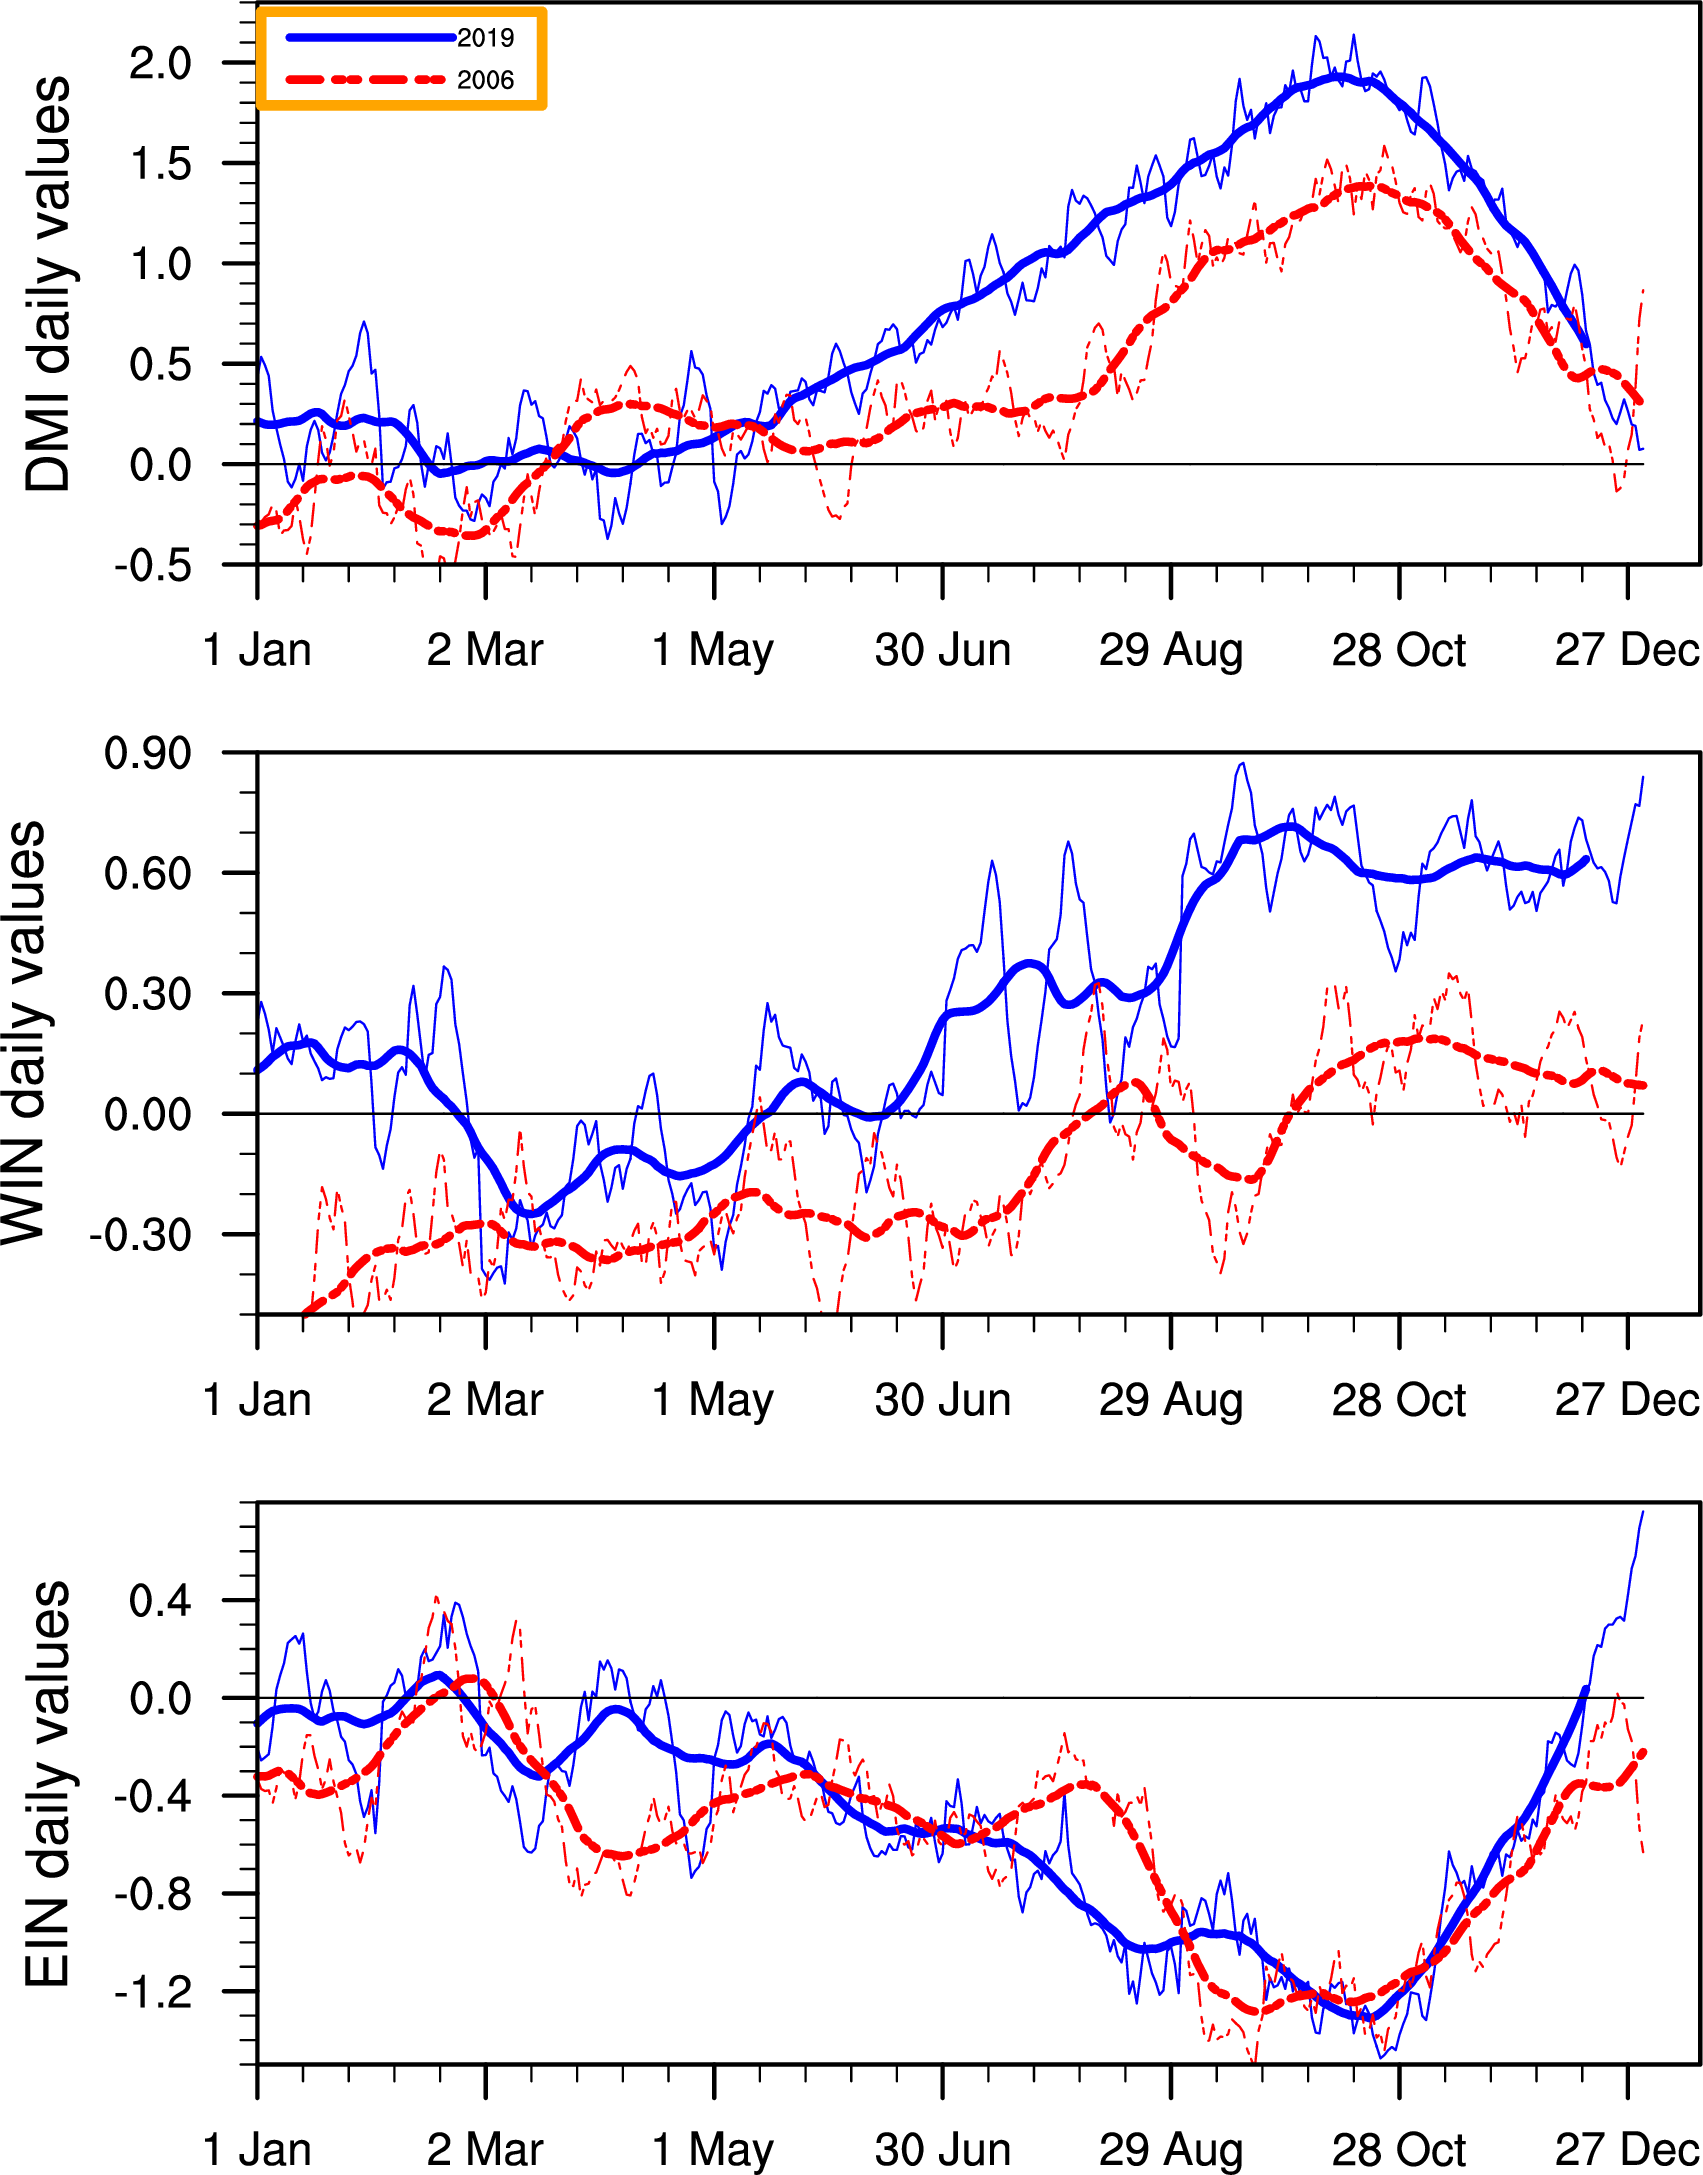
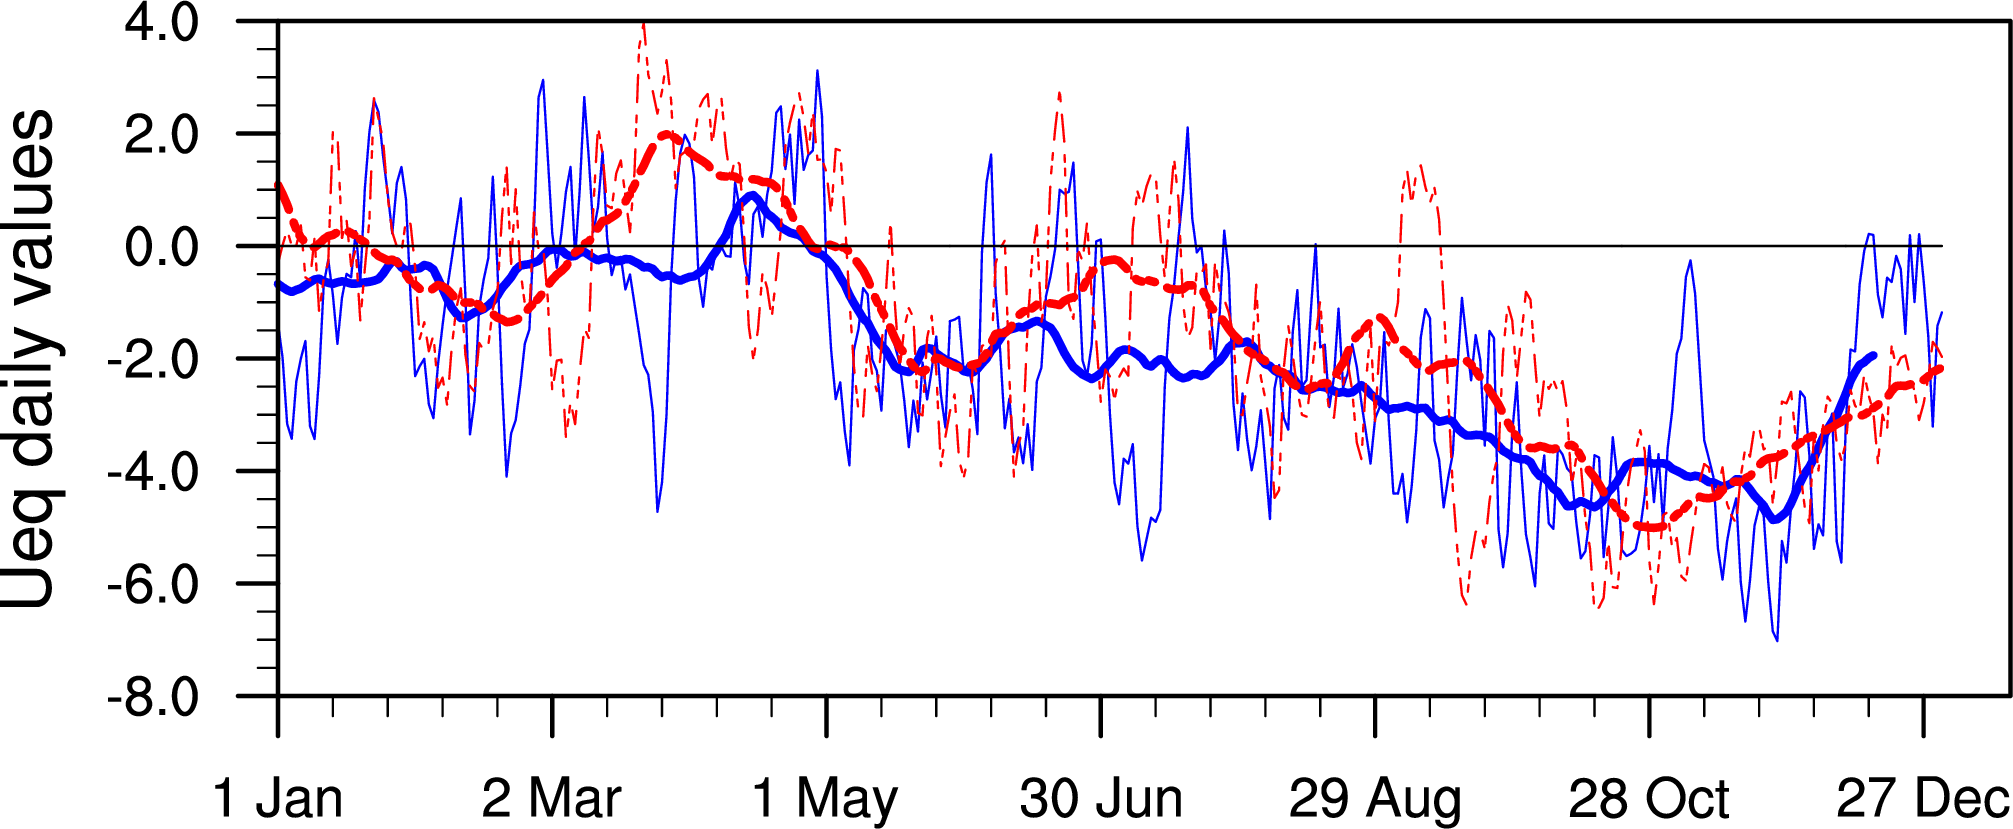
A plot of daily DMI, WIN, and EIN from 01 Jan 2006 to 31 Aug 2019 is compared to the same quantities during 2006 (For this plot, I have extended the quantities mentioned till 31Dec2006, so that you can see how the 2006 IOD evolved after August). The thicker lines show daily timeseries smoothed using a 91-day (3-month) running mean.
 I will add my comments on these plots later.
---
I will add my comments on these plots later.
---